AUD/USD Price Forecast: Key resistance area remains above 0.6300
- AUD/USD advanced further and came just short of the 0.6300 mark.
- The US Dollar remained offered as the tariffs narrative lost traction.
- China’s Caixin PMIs came in on the weak side in January.

The US Dollar (USD) retreated further on Wednesday, down for the third straight day and forcing the US Dollar Index (DXY) to shed further ground following Monday’s peaks north of the 110.00 mark. Extra weakness in the Greenback came in response to the loss of traction of United States (US) Donald Trump’s tariffs narrative, as intense uncertainty and lack of details kept lingering over the White House’s trade policies.
Australian Dollar gains momentum
In contrast, the Australian dollar (AUD) managed to extend its weekly rebound, motivating AUD/USD to bounce back from levels not seen since April 2020, when it dipped below 0.6100 at the beginning of the week. The pair’s move higher, therefore, flirted with the key resistance zone near the 0.6300 yardstick.
US tariffs and their impact on the Aussie
President Donald Trump’s decision to impose a 25% duty on imports from Canada and Mexico was delayed by a month on Monday, which provided temporary relief in the risk-linked universe and led to a quick sell-off in the Greenback.
On the other hand, the US announced a 10% tariff on Chinese imports, stirring concerns over potential retaliatory measures from Beijing. This is particularly worrisome for Australia, as China is its biggest export market. The looming threat of tariffs might dampen China’s demand for Australia’s valuable resources. Moreover, China has signaled that it might challenge these tariffs at the World Trade Organization (WTO).
Despite the recent dip in the US Dollar, the risk of a trade war remains high. Such tensions could reignite inflation in the US and force the Federal Reserve (Fed) to keep interest rates high for longer.
Riding the wave: AUD’s recent moves
Earlier in January, the AUD briefly rallied past the 0.6300 mark against the US Dollar, clinching at the same time new yearly peaks. However, this boost was more about a weaker US Dollar than an improvement in Australia’s economic fundamentals.
There’s growing speculation about what the Reserve Bank of Australia (RBA) might do at its February gathering, especially since recent data indicates that inflationary pressures in Australia are easing.
In fact, the latest Q4 Consumer Price Index (CPI) figures showed that headline inflation rose by 2.4% YoY, down from 2.8% in the previous quarter. Even more notably, the trimmed mean CPI—a key indicator for the RBA—dropped to a three-year low of 3.2%, falling short of both expectations and previous forecasts. This softer inflation data has led many to expect a quarter percentage point rate cut at the RBA’s February 18 meeting, with further easing possibly adding up to 85 basis points over the next year as the central bank shifts to a more dovish stance.
Commodity markets and the Aussie
On the commodity side, although weak demand from China has generally put pressure on Australian exports like iron ore and copper (which usually help support the AUD), prices for these commodities have been recovering so far this week, which in turn morphed into extra legs for the Aussie.
Looking ahead for the AUD
The future of the AUD is uncertain. A more accommodative monetary policy at home, combined with a sluggish Chinese economy, could continue to weigh on the currency. At the same time, if the Federal Reserve (Fed) maintains its tighter policy stance, the interest rate gap between the US and Australia could widen, potentially further pressuring the AUD downward.
Technical insights
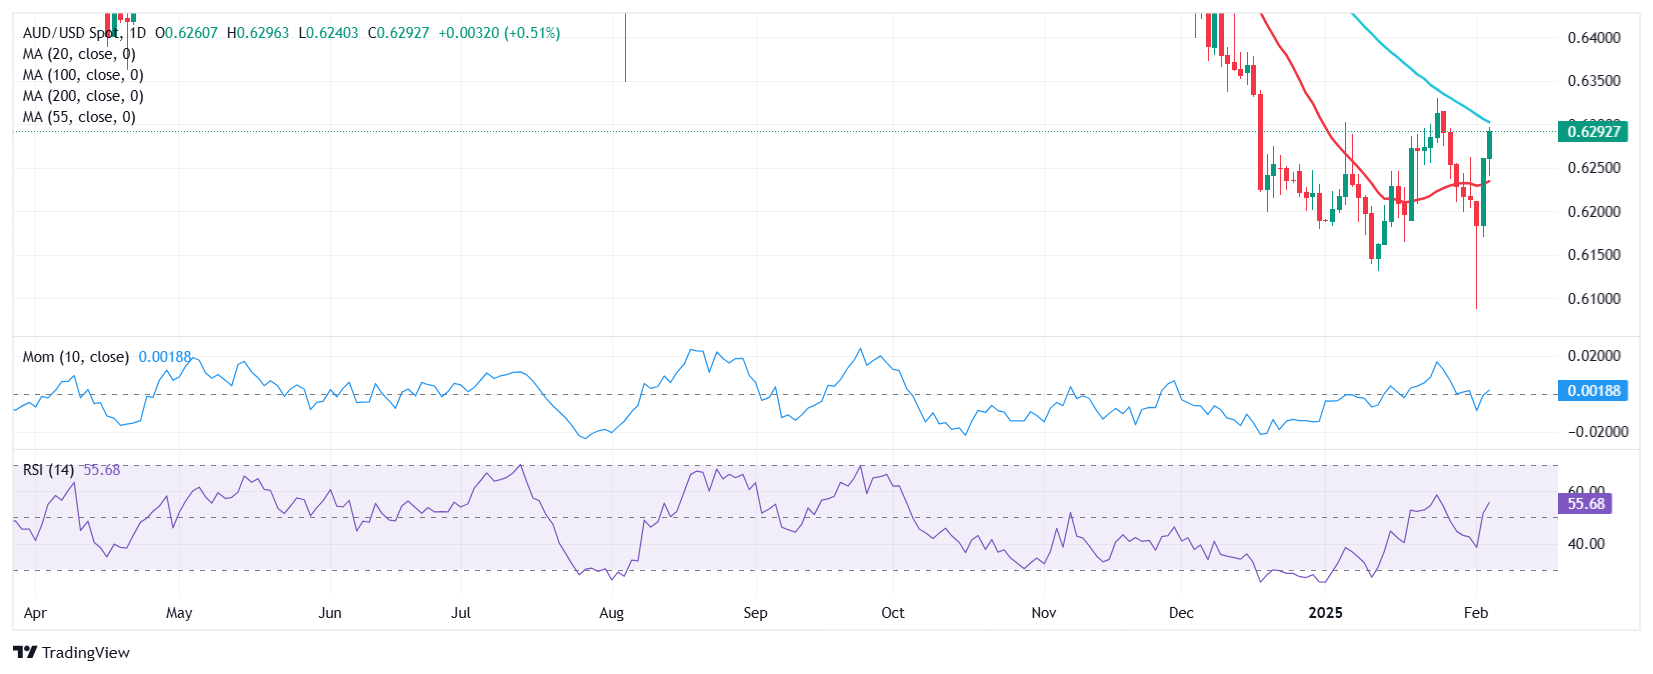
From a technical perspective, caution is warranted. For AUD/USD, key support is at 0.6087—the lowest level seen in 2025. A break below this could push the pair toward the 0.6000 level. On the upside, resistance is observed at 0.6330, the highest point this year, with further resistance at the weekly top of 0.6549 (from November 25).
Encouragingly, momentum indicators show some mixed signs. The Relative Strength Index (RSI) has climbed above the 55 level, suggesting bullish pressure, while the Average Directional Index (ADX) remains near 20, hinting that the current trend might be losing its strength.
What’s next? Key data to watch
Looking forward, all eyes will be on domestic data such as the Balance of Trade results in December.
Back to the Chinese docket, the Caixin Services PMI receded a tad to 51.0 in the first month of the year (from 52.2), adding to the lower prints recorded by the Caixin Manufacturing PMI on Monday (50.1).
Premium
You have reached your limit of 3 free articles for this month.
Start your subscription and get access to all our original articles.
Author

Pablo Piovano
FXStreet
Born and bred in Argentina, Pablo has been carrying on with his passion for FX markets and trading since his first college years.


