AUD/USD Price Forecast: Gains remain capped by the 200-day SMA
- AUD/USD flirted once again with yearly peaks around 0.6440.
- The US Dollar bounced off recent three-day troughs despite lower yields.
- Next on tap in Oz will be the advanced Manufacturing and Services PMIs.

On Tuesday, the Australian Dollar (AUD) lost some upside traction, sending AUD/USD back toward the 0.6370 region despite the earlier advance to the area of yearly peaks around 0.6440.
The late retracement in the pair came on the back of a pick-up in the buying interest around the US Dollar (USD) amid unabated jitters over the US–China tariff feud and renewed fears over the Fed’s independence, which emerged as another source of concerns for market participants.
President Trump’s recent decision to impose duties of 10 %–50 % across a wide range of imports—including a headline‑grabbing 145 % levy on select Chinese goods—has reignited fears of an all‑out trade war. Australia’s heavy economic reliance on China leaves the Aussie especially vulnerable to each fresh salvo in Beijing and Washington’s tariff exchange.
Central bank standoff
Both major central banks have signalled caution. In March, the Federal Reserve (Fed) held its policy rate at 4.25 %–4.50 %, with Chair Jerome Powell warning that anchoring inflation expectations remains the Fed’s paramount task, even as higher tariffs threaten to trigger stagflation. He also stressed that price stability is the bedrock for sustainable job growth and hinted any future rate cuts will hinge on how inflation and growth evolve over time.
Meanwhile, the Reserve Bank of Australia (RBA) left its cash rate at 4.10 % earlier this month, with Governor Michele Bullock pointing to sticky inflation and a tight labour market as reasons to delay a rate cut. So far, investors currently see about a 70% chance of a rate reduction at the bank’s May event.
Speculative bets remain in place
CFTC’s positioning data revealed a pullback in bearish bets on the Aussie. Indeed, net short positions have fallen to a five‑week low near 59K contracts in the week ending April 15, accompanied by a decline in open interest.

Technical barriers
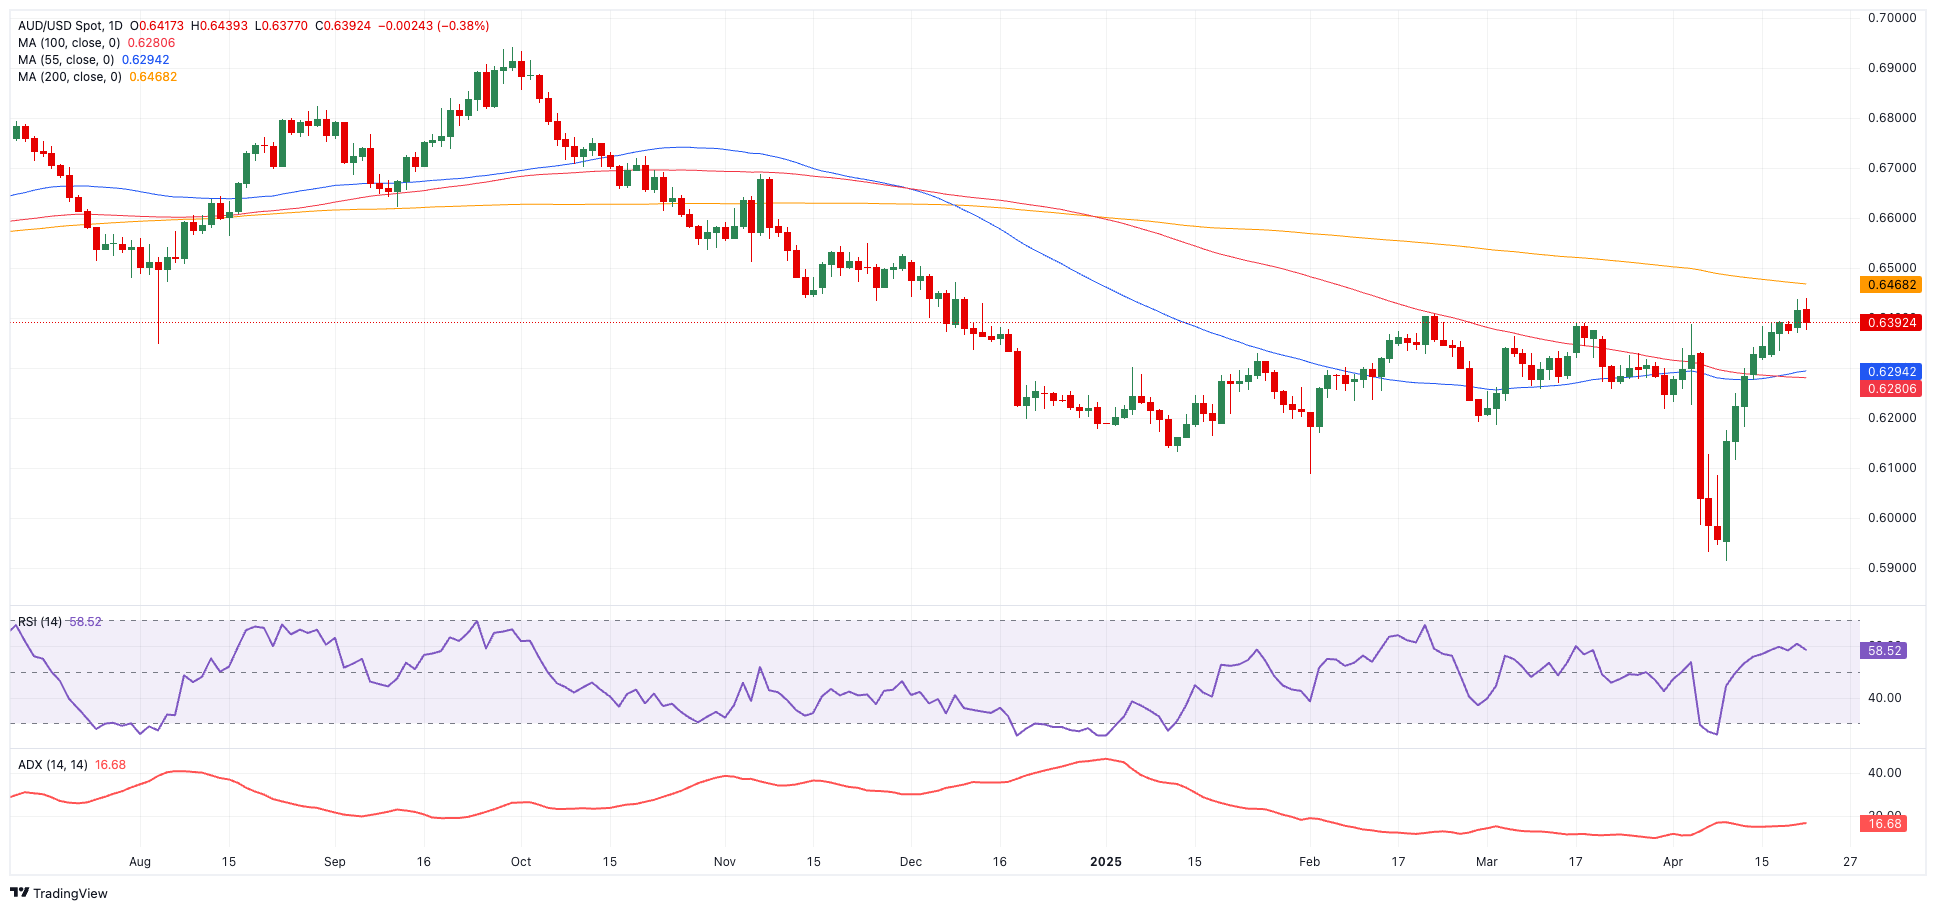
From a chart‑based perspective, the pair remains capped below its 200‑day simple moving average (SMA) at 0.6472. A convincing break above would first target the 2025 high at 0.6408 (February 21), then the November 7 2024 top of 0.6687.
Conversely, a failure to hold the YTD bottom of 0.5913 (April 9) could open the door to the March 19 2020 trough of 0.5506.
Momentum indicators are mixed: the Relative Strength Index (RSI) sits near 59, suggesting room to run, while an Average Directional Index (ADX) around 16 still warns the current up‑move lacks some conviction.
AUD/USD daily chart
Outlook
With each new tariff headline or surprise data release capable of roiling markets, the Aussie’s fate remains tightly bound to developments in Washington and Beijing—as well as the next policy signals from both the Fed and the RBA. Until clarity emerges on the trade front or one central bank breaks ranks, volatility in AUD/USD is likely to persist.
Author

Pablo Piovano
FXStreet
Born and bred in Argentina, Pablo has been carrying on with his passion for FX markets and trading since his first college years.


