AUD/USD Price Forecast: Bullish shift targets the YTD peaks
- AUD/USD added to Tuesday’s advance and pierced the 0.6500 barrier.
- The US Dollar lost its grip and retreated to multi-day troughs.
- The Ai Group Index in Australia improved to -3.2 in July.

The Australian Dollar (AUD) picked up extra pace on Wednesday, motivating AUD/USD to build on Tuesday’s gains and surpass, albeit briefly, its key resistance zone around the 0.6500 level.
The ongoing upward trend coincided with another wave of weakness affecting the US Dollar (USD), as investors continued to evaluate trade developments amid increasing speculation about who might succeed Chief Powell at the Federal Reserve (Fed).
Inflation and growth signals clash
Inflation in Australia proved stubborn in Q2, with headline CPI rising 0.7% QoQ (2.1% YoY) and June’s Monthly CPI Indicator printing 1.9%. The RBA’s favoured trimmed-mean measure ticked up 0.6% QoQ and 2.7% over the last twelve months, offering only meagre relief from core price pressures.
Yet there were brighter spots: The manufacturing PMI rebounded to 51.6 and the services PMI to 53.8—both comfortably in expansion territory—and retail sales jumped 1.2% in June. Cooling, however, crept into the jobs market, where just 2K positions were added last month, pushing unemployment to 4.3% amid a higher participation rate (67.1%).
RBA opts for patience
At its early-August meeting, the Reserve Bank of Australia (RBA) kept the cash rate at 3.85%, a decision Governor Michele Bullock described as “one of timing rather than direction.” She reiterated that rate cuts remain on the table if inflation continues its slow descent. Markets are still pencilling in roughly 75 basis points of easing over the next year, with August moves neither ruled in nor out. In addition, Deputy Governor Andrew Hauser called June’s inflation data “very welcome” in his latest remarks but stressed that any rate cuts would follow a cautious, measured path.
China’s patchy rebound
Down Under’s biggest customer, China, showed a similarly mixed picture. Q2 GDP grew 5.2% YoY, and industrial output climbed 7%, but retail sales lagged below 5%. Beijing left its one- and five-year Loan Prime Rates (LPRs) unchanged at 3.00% and 3.50%, respectively. July’s official (NBS) manufacturing and non-manufacturing PMIs slipped to 49.3 and 50.1, while the Caixin surveys diverged—manufacturing at 49.5, services up at 52.6—underscoring that Beijing’s rebound remains fragile.
Policy split pins down the Aussie
With the Fed signalling caution on US inflation and trade tensions simmering, yield differentials have kept the Aussie pinned in its summer range. The RBA’s flirtation with rate cuts has done little to break that pattern.
Traders pare back bearish bets
Meanwhile, CFTC data to July 29 show speculators trimming their net short AUD positions to just over 78K contracts, or two-week lows, while open interest eased to around 159.7K contracts.
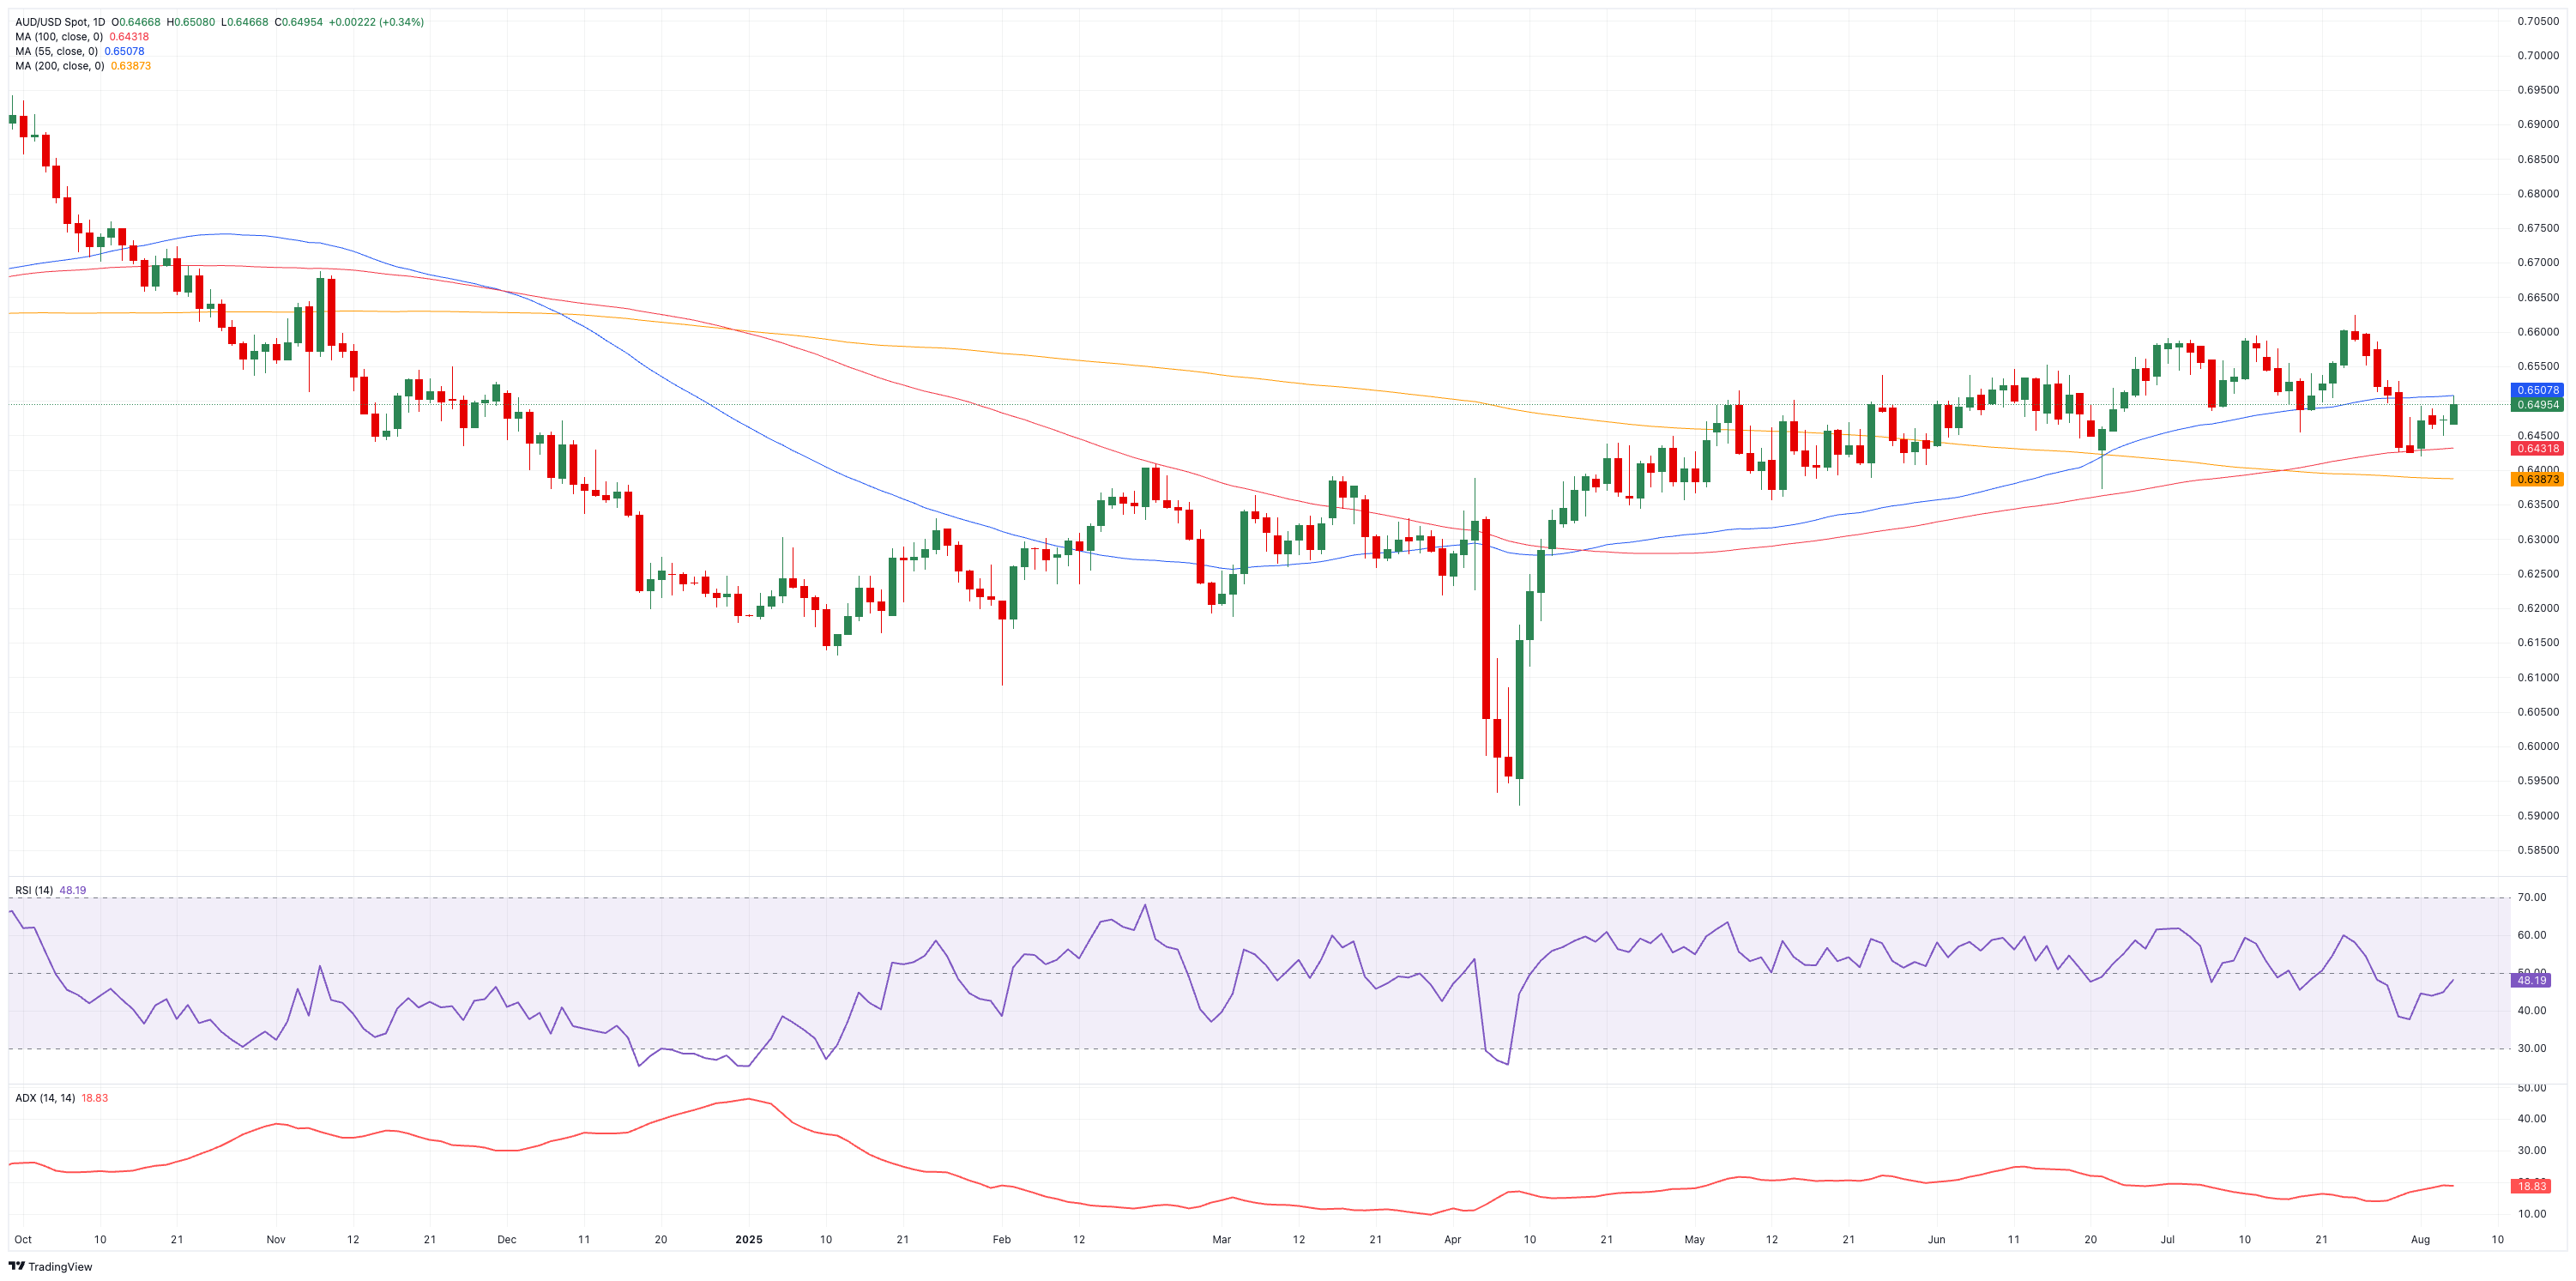
Critical chart levels
To the upside, resistance looms at the YTD peak of 0.6625 (July 24) and then the November 2024 high of 0.6687 (November 7), all before the make-or-break 0.7000 threshold.
On the flip side, initial support comes at the August base of 0.6418 (August 1), ahead of the key 200-day SMA at 0.6389, and the June trough of 0.6372 (June 23).
Momentum indicators unveil a mixed scenario: while the Relative Strength Index (RSI) is approaching the 48 level, hinting at a pick-up in the upside impulse, the Average Directional Index (ADX) near 19 is indicative that the trend still lacks conviction.
Looking ahead
Absent a surprise rebound in China, a shift in Fed guidance or an unexpected RBA move, the Australian Dollar looks set to meander within its familiar 0.6400–0.6600 corridor—waiting for a fresh catalyst to spark the next major breakout.
US-China Trade War FAQs
Generally speaking, a trade war is an economic conflict between two or more countries due to extreme protectionism on one end. It implies the creation of trade barriers, such as tariffs, which result in counter-barriers, escalating import costs, and hence the cost of living.
An economic conflict between the United States (US) and China began early in 2018, when President Donald Trump set trade barriers on China, claiming unfair commercial practices and intellectual property theft from the Asian giant. China took retaliatory action, imposing tariffs on multiple US goods, such as automobiles and soybeans. Tensions escalated until the two countries signed the US-China Phase One trade deal in January 2020. The agreement required structural reforms and other changes to China’s economic and trade regime and pretended to restore stability and trust between the two nations. However, the Coronavirus pandemic took the focus out of the conflict. Yet, it is worth mentioning that President Joe Biden, who took office after Trump, kept tariffs in place and even added some additional levies.
The return of Donald Trump to the White House as the 47th US President has sparked a fresh wave of tensions between the two countries. During the 2024 election campaign, Trump pledged to impose 60% tariffs on China once he returned to office, which he did on January 20, 2025. With Trump back, the US-China trade war is meant to resume where it was left, with tit-for-tat policies affecting the global economic landscape amid disruptions in global supply chains, resulting in a reduction in spending, particularly investment, and directly feeding into the Consumer Price Index inflation.
Premium
You have reached your limit of 3 free articles for this month.
Start your subscription and get access to all our original articles.
Author

Pablo Piovano
FXStreet
Born and bred in Argentina, Pablo has been carrying on with his passion for FX markets and trading since his first college years.


