|

AUD/USD is battling very strong resistance after the surge — Confluence Detector

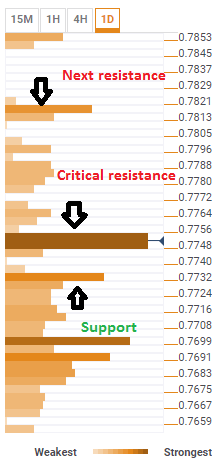
After the Aussie shot higher, the Technical Confluences Indicator shows that it faces the convergence of several important lines of resistance at A$0.7755. The area is the meeting point of the Fibonacci 28.2% one month, the Pivot Point one-day R2, the SMA200-4h, the 4-hour high, and the SMA10-15 minutes.

A break above this level does not mean a clear path to the upside, but there are no significant clusters until 0.7815, where the 61.8% Fibo level (one month) meets the SMA50 one-day. All the lines in between are of a lower technical grade.

Looking down, a failure to move higher will open the door to the downside. A meaningful confluence of levels awaits around 0.7728: the one-week high, the Bolinger Band 1h-Upper (Stdv. 2.2), the BB 1 day-Middle, the SMA50 15 minutes and the SMA10 one hour.

The move to the upside was inspired by a pledge for openness by Chinese President Xi Jinping and talks about negotiation on trade by Trump's adviser Peter Navarro. The Australian dollar rallied on hopes for improving trade. 

Here is how it looks on the tool:

AUD USD confluence April 11 2018 technical chart

Confluence Detector

The Confluence Detector finds exciting opportunities using Technical Confluences. The TC is a tool to locate and point out those price levels where there is a congestion of indicators, moving averages, Fibonacci levels, Pivot Points, etc. Knowing where these congestion points are located is very useful for the trader, and can be used as a basis for different strategies.

This tool assigns a certain amount of “weight” to each indicator, and this “weight” can influence adjacents price levels. This means that one price level without any indicator or moving average but under the influence of two “strongly weighted” levels accumulate more resistance than their neighbors. In these cases, the tool signals resistance in apparently empty areas.

Learn more about Technical Confluence

Author

Yohay Elam

Yohay Elam

FXStreet

Yohay is in Forex since 2008 when he founded Forex Crunch, a blog crafted in his free time that turned into a fully-fledged currency website later sold to Finixio.

More from Yohay Elam
Share:

Editor's Picks

AUD/USD falls to near 0.7100 after slipping below 50-day EMA

AUD/USD depreciates after registering minor gains in the previous day, trading around 0.7120 during the Asian hours. The technical analysis of the daily chart shows the pair consolidating sideways within a rectangle pattern, as neither bulls nor bears gain control. The AUD/USD pair is holding a slight bearish tone however as it sits beneath both the nine-day and 50-day EMAs.

160.00: USD/JPY back near intervention territory after upbeat US jobs report

US Nonfarm Payrolls beat expectations by a wide margin in May, with 172K jobs added. The US Dollar rebounds after the release, helping USD/JPY recover from its intraday lows. Warnings from Japanese authorities continue to limit upside potential near the 160.00 threshold.

Gold targets $4,300 amid stronger Dollar

Gold faces increasing selling interest and navigates the area of three-month lows near the $4,300 mark per troy ounce on Friday. The precious metal’s decline comes as traders assess the stronger-than-expected NFP, while the bid bias in the Greenback and higher US Treasury yields also collaborate with the retracement.

Cardano hits five-year low even as Hoskinson clarifies "break" isn't an exit

Cardano (ADA) price is down 10% at press time on Friday, extending losses over 30% so far this week amid Charles Hoskinson's clarification that "break" isn't an exit.

Week ahead – Fed countdown begins amid US inflation data and geopolitical risks

Fed Chair Warsh’s first meeting approaches as key US inflation data could reshape expectations. Oil prices remain elevated as US-Iran talks continue; tariffs also return to the spotlight. ECB is expected to hike; will it be a one-off move or is July live?

The US economy defies the rules: 100 days into the Oil shock and the recession signal is still missing

More than three months after the start of the Iran war and the resulting disruption to global energy markets, the US economy continues to display remarkable resilience. The conflict has triggered a sharp rise in Oil prices, reignited inflationary pressures and fueled widespread concerns about a potential economic slowdown.