AUD/USD Forecast: Upbeat Australian data and equities saved the day

AUD/USD Current Price: 0.7087
- European central banks’ decisions provided an unexpected boost to the US Dollar.
- The positive tone of global indexes limited AUD/USD intraday decline.
- AUD/USD eased from its recent peaks, but further slides seem unclear.
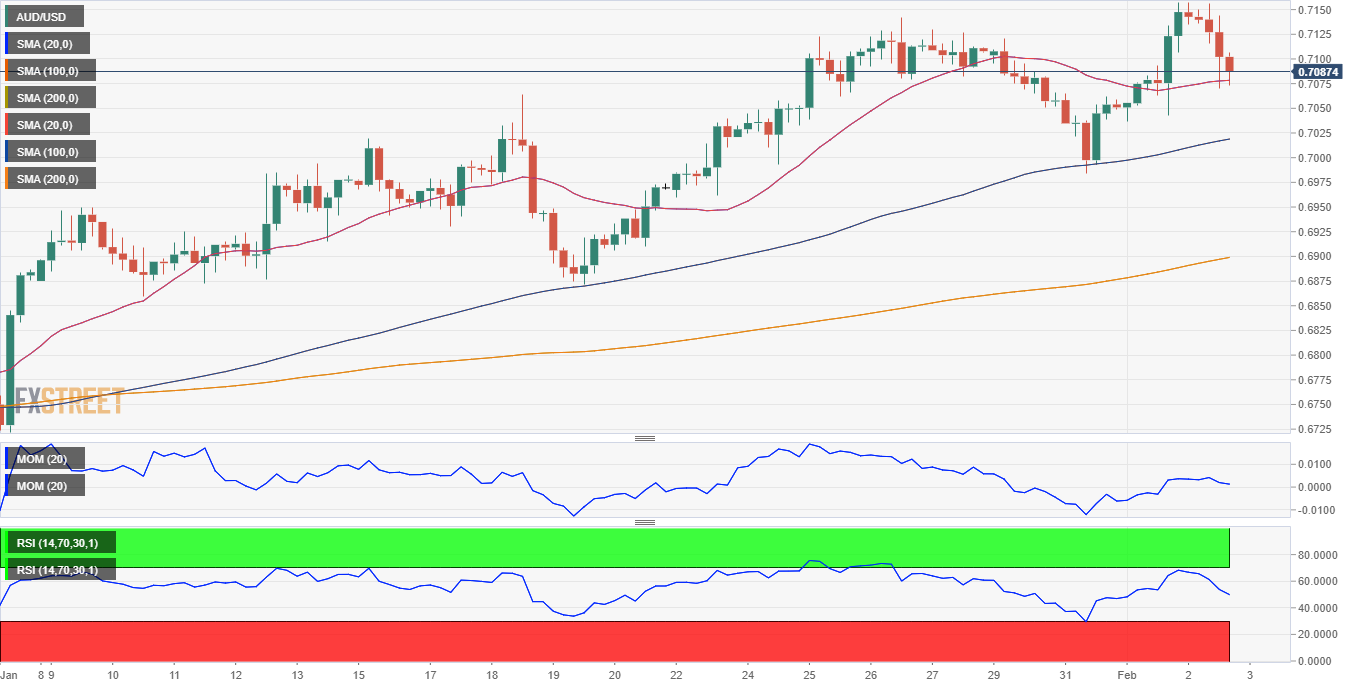
The AUD/USD pair trades at around 0.7080, easing from a fresh multi-month high of 0.7157. The US Dollar trimmed its post-Fed losses amid the monetary policy decisions of the European Central Bank (ECB) and the Bank of England (BoE). The Greenback advanced despite easing US government bond yields and the mostly positive tone of equities, as the European central banks disappointed market players, boosting demand for the American currency.
On the one hand, the ECB hiked rates by 50 bps and anticipated an equal one for March. President Christine Lagarde said that after that, it will be a meeting-by-meeting decision that will depend on macroeconomic data. The BoE also hiked by 50 bps but hinted at a better economic perspective than previously suspected. Speculative interest rushed to price in a slower pace of tightening or a potential pivot.
Wall Street opened with substantial gains, led by encouraging Tesla results. The Nasdaq Composite and the S&P500 spent the day in the green, although the Dow Jones Industrial Average struggled to advance, posting a modest intraday slide.
Meanwhile, Australian data released at the beginning of the day came in better-than-anticipated. Building Permits were up 18.5% MoM in December, recovering from an 8.8% decline in the previous month and well above the 1% anticipated by the market. Early on Friday, Australia will publish the AIG Performance of Construction Index and the S&P Global Services PMI for January and December Home Loans.
Ahead of the weekly close, the United States will publish the January Nonfarm Payrolls report, with the market anticipating the creation of 185K new job positions and an unemployment rate of 3.6%.
AUD/USD short-term technical outlook
The AUD/USD pair daily chart shows that technical indicators ease within positive levels, reflecting the ongoing decline rather than anticipating a bearish continuation. At the same time, the pair is developing above a firmly bullish 20 SMA, which extended its advance above directionless longer ones. The mentioned 20 SMA stands around 0.7000, reinforcing the static support area.
In the near term and according to the 4-hour chart, the risk of a downward extension seems limited. The pair is seesawing around a flat 20 SMA, although the longer ones maintain their upward slopes below it. The Momentum indicator eased modestly from its weekly peak but lacks bearish strength, while the RSI turned flat within neutral levels. A relevant near-term support level comes at 0.7030, with a break below favoring additional declines.
Support levels: 0.7070 0.7030 0.6995
Resistance levels: 0.7110 0.7145 0.7190
Author

Valeria Bednarik
FXStreet
Valeria Bednarik was born and lives in Buenos Aires, Argentina. Her passion for math and numbers pushed her into studying economics in her younger years.