AUD/USD Forecast: Some near-term consolidation appears on the cards
- AUD/USD traded without a clear direction near 0.6540.
- Next on the upside is the 200-day SMA.
- Retail Sales and inflation in Australia appear as the next risk events for AUD.

The mild upside pressure on the US Dollar (USD) sparked an equally lacklustre pullback in AUD/USD on Tuesday, maintaining the trade in the 0.6540 region and fading part of Monday’s decent advance.
While the movements of the USD continued to dictate the pair's behaviour, the lack of traction in both copper prices and iron ore also contributed to the side-lined move in spot.
Meanwhile, the economic situation in China is anticipated to have an impact on the AUD as well. Potential stimulus measures by both the government and the PBoC might provide temporary relief, but sustained improvements in economic indicators are necessary to bolster the Australian currency and potentially trigger a significant uptrend in AUD/USD.
In the meantime, AUD/USD seems to have managed to digest the dovish tone from the Reserve Bank of Australia (RBA), after it left the OCR unchanged at 4.35% at its meeting on March 19. It's important to note that the RBA is one of the last G10 central banks expected to consider adjusting interest rates this year.
Moving forward, the next risk event for the Aussie dollar is expected with the publication of Retail Sales in Australia for the month of February and Consumer Inflation Expectations, both due on March 28.
Given the differing timelines for monetary policy adjustments between the RBA and the Fed, the Australian dollar may gain momentum later in the year, potentially leading to further appreciation in AUD/USD. If the pair surpasses the peak of 0.6871 in December 2023, it could target the significant level of 0.7000 in the near term.
AUD/USD daily chart
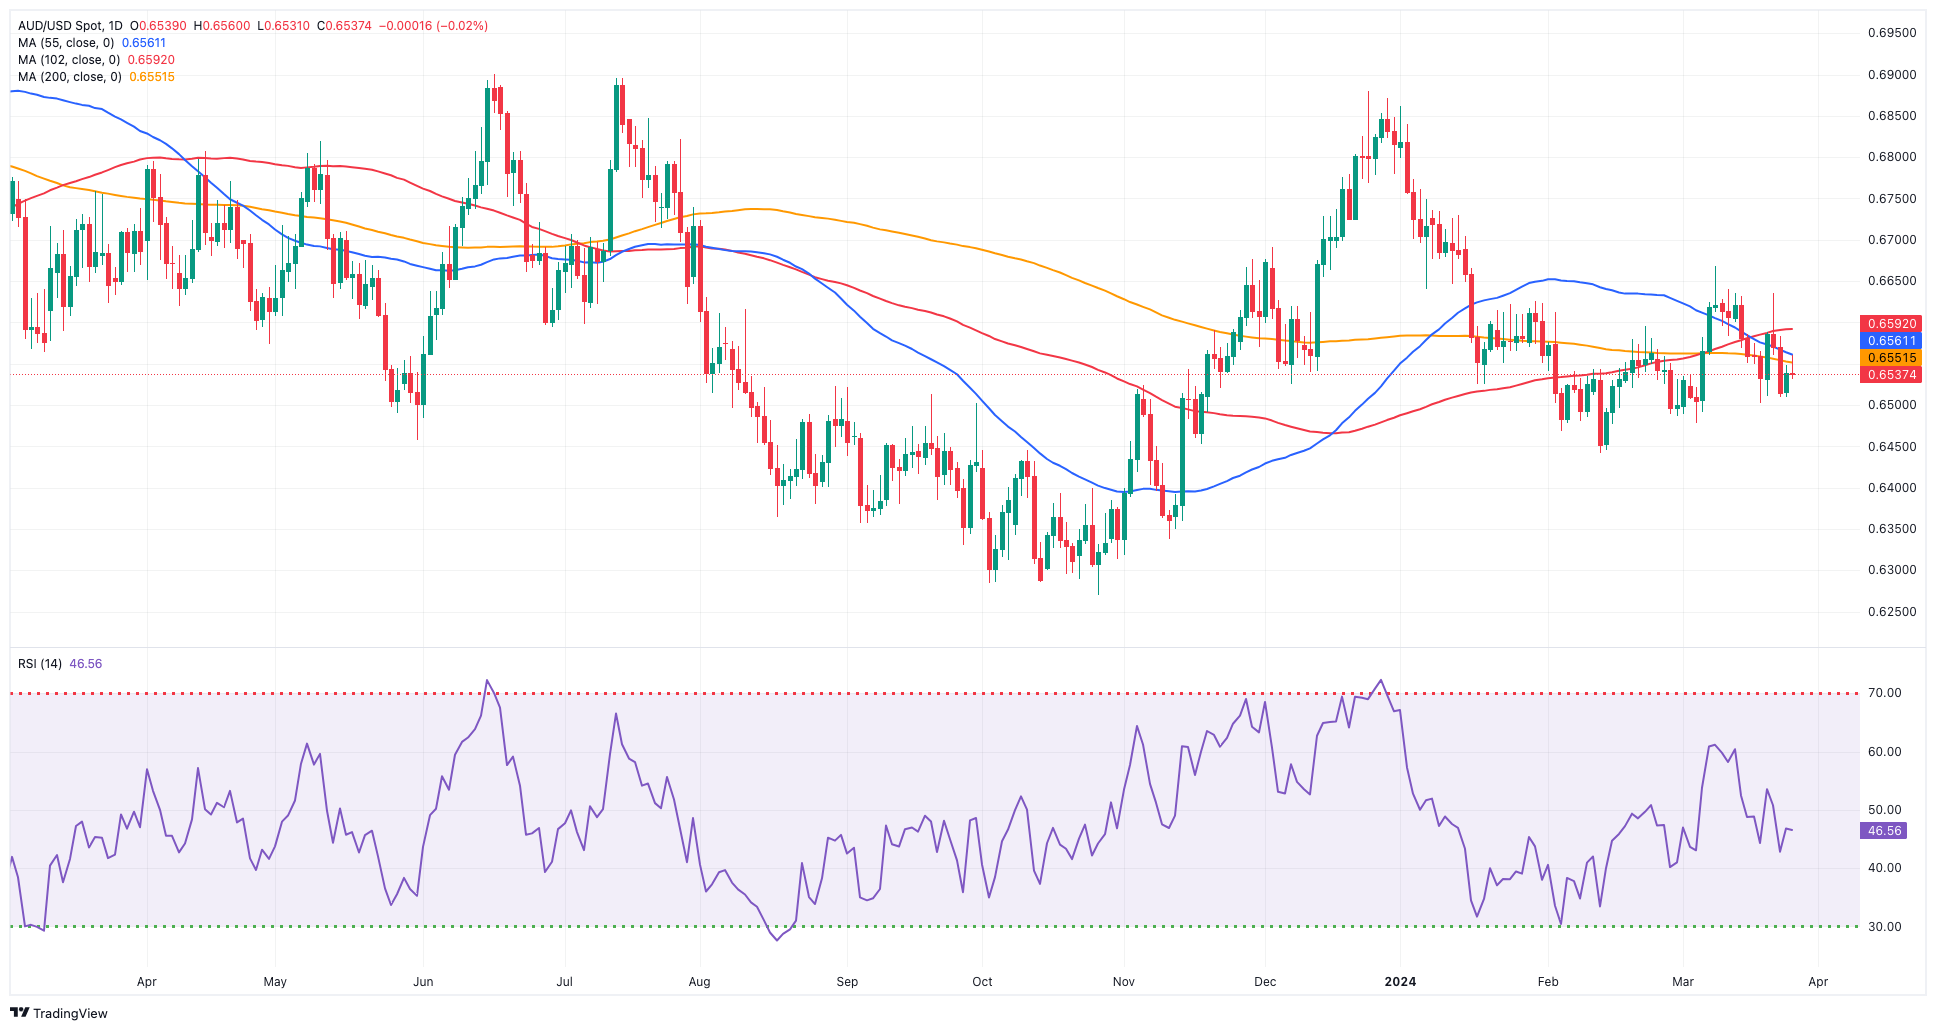
AUD/USD short-term technical outlook
Further upward momentum in the AUD/USD could see a break above the March peak of 0.6667 (March 8) ahead of the December 2023 high of 0.6871 (December 28), followed by monthly tops of 0.6894 (July 14) and 0.6899 (June 16), all before the key 0.7000 barrier.
If sellers retake control, the pair may reach a weekly low of 0.6503 (March 19). Once this zone is cleared, spot could revisit the March low of 0.6477 (March 5), seconded by the 2024 low of 0.6442 (February 13). Breaking below this level may result in a probable test of the 2023 low of 0.6270 (October 26), followed by the round level of 0.6200 and the 2022 low of 0.6169 (October 13).
Looking at the broader picture, the pair is expected to regain the bullish outlook once it surpasses the key 200-day SMA of 0.6550 on a convincing note.
On the 4-hour chart, the pair appears to have regained some upward momentum. Against this, there is a provisional resistance at the 100-SMA of 0.6566 ahead of 0.6634, followed by 0.6638 and 0.6667. On the other hand, additional losses may cause the pair to retest 0.6509, then 0.6503, 06477, and eventually 0.6442. Furthermore, the MACD remained slightly negative, and the RSI dropped below 47.
Author

Pablo Piovano
FXStreet
Born and bred in Argentina, Pablo has been carrying on with his passion for FX markets and trading since his first college years.















