AUD/USD Forecast: Extra gains need to clear 0.6700
- AUD/USD’s advance faltered just ahead of 0.6700.
- Further selling in the US Dollar lent wings to AUD.
- The final Judo Bank Manufacturing PMI came in a tad higher.

The unabated selling pressure on the US Dollar (USD) led to additional gains in AUD/USD, resulting in three consecutive sessions of gains and a move to the proximity of 0.6700 the figure on Monday.
The fresh offered stance on the Greenback came amidst investors' assessments of the potential for the Federal Reserve (Fed) to begin its easing programme later this year, possibly in November. In fact, this view was underpinned by discouraging prints from the US Manufacturing PMI gauged by ISM for the month of May.
This outlook appeared somewhat in contrast to the recent cautious comments from several Fed officials, who emphasized the need for more evidence of inflation moving towards the Fed's target before considering rate cuts.
Daily gains in the Australian dollar were also propped by some rebound in copper prices vs. a slight decline in iron ore prices.
Regarding monetary policy, the Minutes of the Reserve Bank of Australia (RBA) highlighted discussions on interest rate hikes. The RBA might be among the last major central banks, along with the Fed, to adjust its monetary policy.
So far, money markets see around 25 bps of easing by July 2025, while rate hikes remain largely on the table for the remainder of the year. Supporting the latter, the RBA’s Monthly CPI Indicator (also known as the Weighted Mean CPI) rose more than expected by 3.6% in April, up from 3.5%.
Given the Fed's commitment to monetary policy tightening and the likelihood of the RBA maintaining its restrictive stance for an extended period, further consolidation in AUD/USD is expected in the coming months.
AUD/USD daily chart
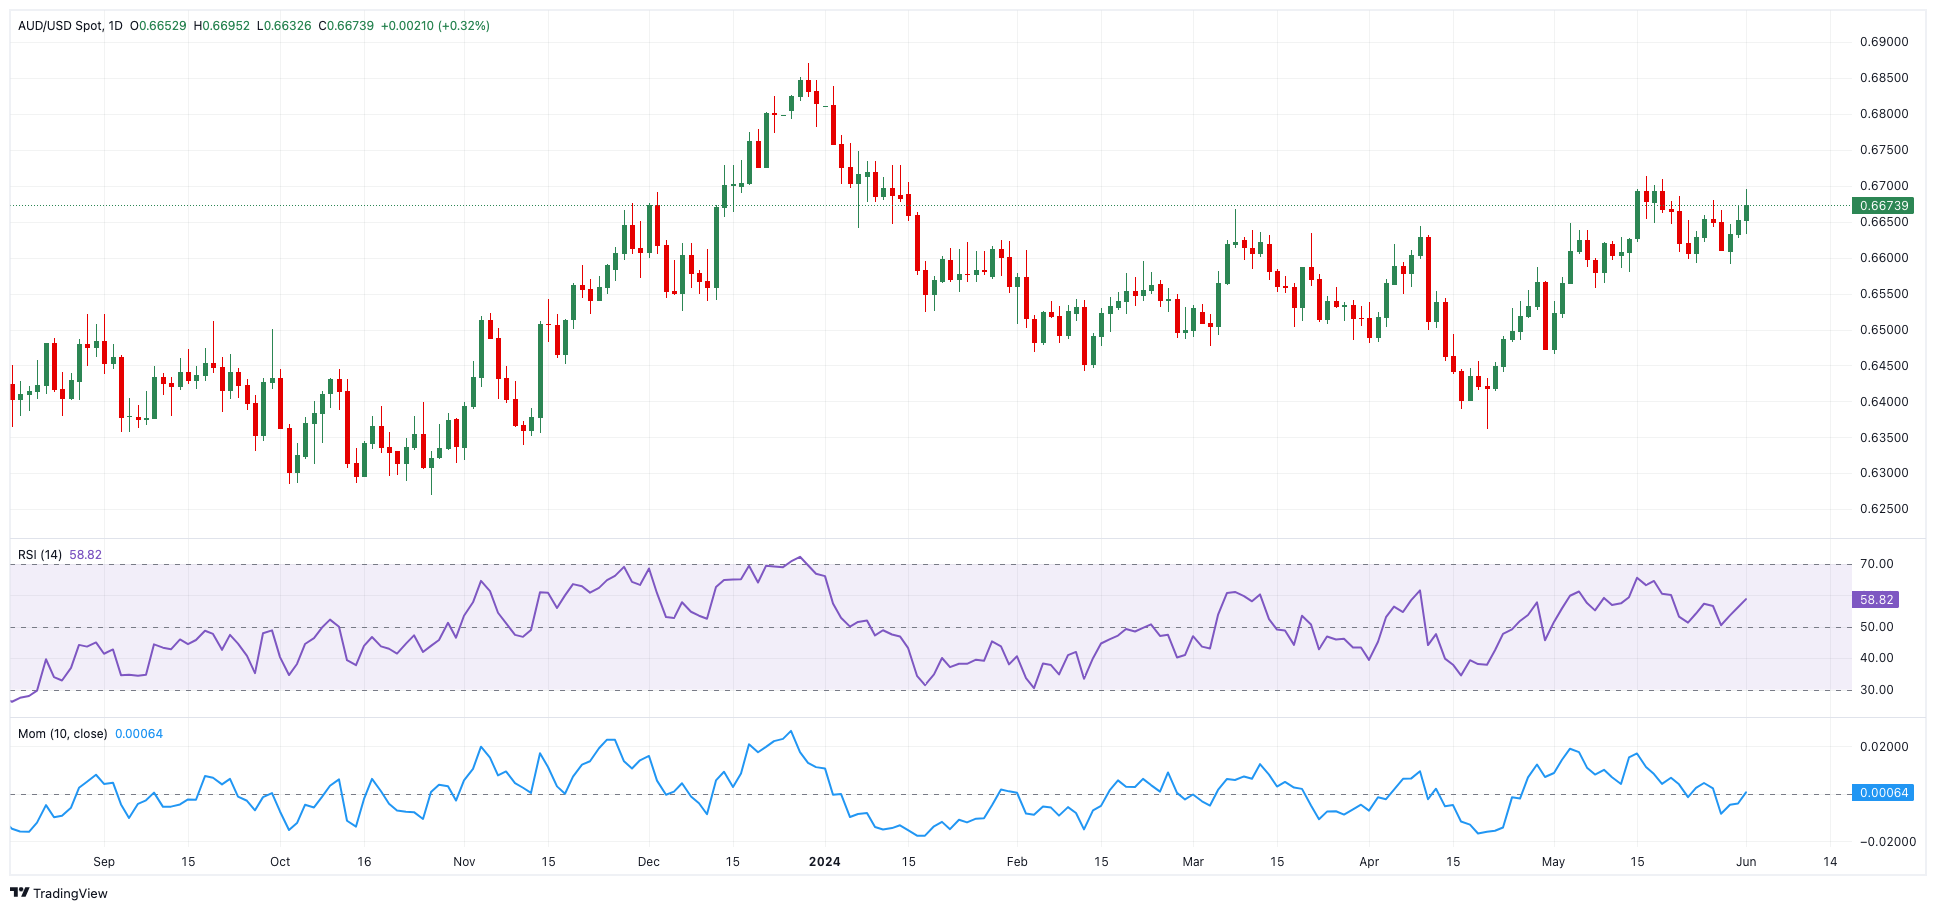
AUD/USD short-term technical outlook
Extra gains may drive the AUD/USD to test the May high of 0.6714 (May 16), before aiming for the December 2023 top of 0.6871 and the July 2023 peak of 0.6894 (July 14), all ahead of the important 0.7000 level.
Meanwhile, bearish attempts may initially push the pair to the intermediate 100-day and 55-day SMAs in the 0.6560 range, followed by the key 200-day SMA at 0.6534. The loss of the latter may result in a return to the May low of 0.6465 and the 2024 bottom of 0.6362 (April 19).
Overall, more gains are expected as long as the price maintains above the 200-day SMA.
A bullish sentiment remains in place on the 4-hour chart. Nonetheless, 0.6695 is the initial up-barrier, followed by 0.6709 and 0.6714. On the other side, 0.6590 provides immediate support ahead of the 200-SMA at 0.6583 and finally 0.6557. The RSI surged to around 60.
Premium
You have reached your limit of 3 free articles for this month.
Start your subscription and get access to all our original articles.
Author

Pablo Piovano
FXStreet
Born and bred in Argentina, Pablo has been carrying on with his passion for FX markets and trading since his first college years.


