AUD/USD Forecast: Caution rises ahead of the 200-day SMA
- AUD/USD’s downtrend remained unabated on Tuesday.
- China and weaker commodity prices kept AUD subdued.
- The pair’s next stop to the downside is the key 200-day SMA.

AUD/USD extended further its multi-day steep decline and approached the 0.6600 neighbourhood, and area coincident with the transitory 100-day SMA, down nearly 2 cents since monthly peaks recorded on July 11 around 0.6800 the figure.
That said, spot faded the monthly rally in the last seven days and traded closer to the critical 200-day SMA, always on the back of poor economic prospects from China, further losses in commodity prices, the rebound in the US Dollar (USD), and the recent interest rate cut by the PBoC.
On the latter, the PBoC's unexpected decision to reduce both short- and long-term interest rates also hurt the Chinese yuan, impacting the Aussie dollar due to Australia's economic dependence on the Chinese market and the AUD’s view as a liquid proxy for the yuan.
Contributing to the sell-off in AUD, both copper prices and iron ore prices maintained their weakness well in place, always amidst the broader decline in the commodity complex.
When it comes to monetary policy, the Reserve Bank of Australia (RBA) appears likely to be the last G10 central bank to start lowering interest rates. In its latest meeting, the RBA maintained a hawkish stance, keeping the official cash rate at 4.35% and indicating flexibility for future decisions. Meeting minutes revealed that officials considered another rate hike to curb inflation but decided against it, partly due to concerns about a potential sharp slowdown in the labour market.
The RBA is in no hurry to ease policy, expecting that it will take time for inflation to consistently fall within the 2-3% target range.
Potential easing by the Federal Reserve in the medium term, contrasted with the RBA’s likely prolonged restrictive stance, could support AUD/USD in the coming months. However, concerns about slow momentum in the Chinese economy might hinder a sustained recovery of the Australian currency as China continues to face post-pandemic challenges, deflation, and insufficient stimulus to kickstart a convincing recovery.
On the data front, the preliminary Manufacturing and Services PMIs tracked by the Judo Bank will be published on Wednesday.
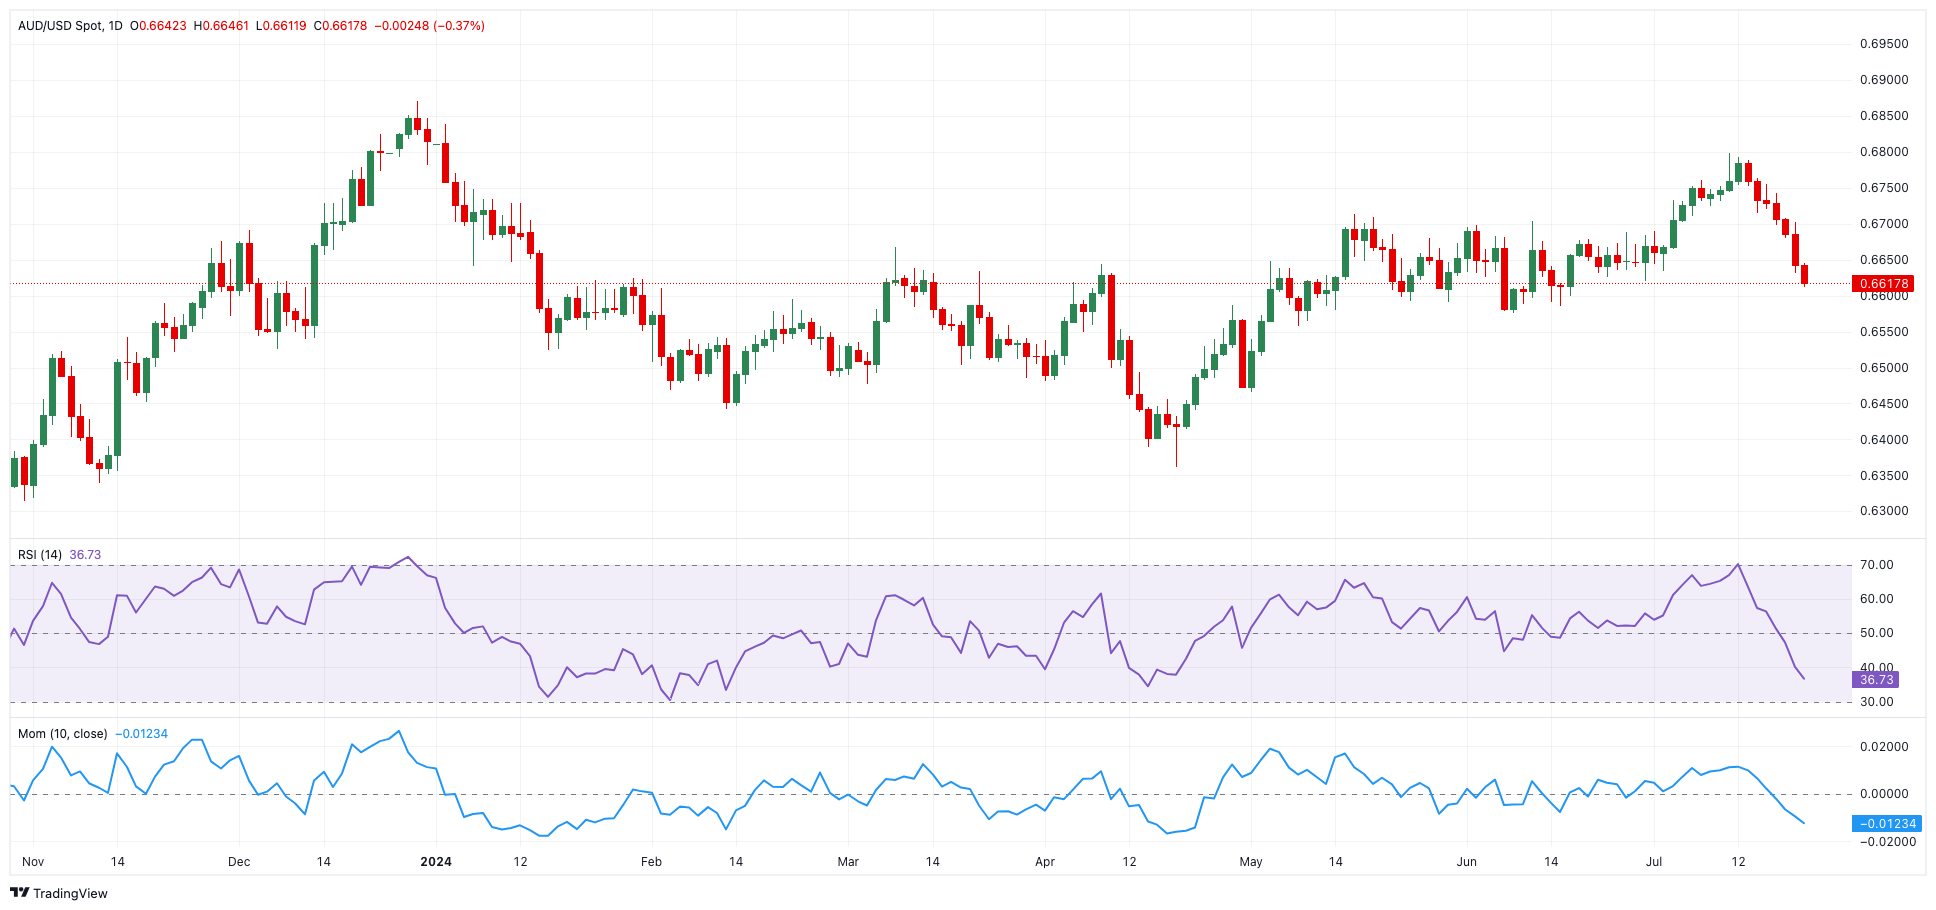
AUD/USD daily chart
AUD/USD short-term technical outlook
Further losses in AUD/USD could find first support at the provisional 100-day SMA at 0.6607 prior to the more relevant 200-day SMA of 0.6583 and the June low of 0.6574 (June 10). From here, the May low of 0.6465 is followed by the 2024 bottom of 0.6362 (April 19).
Occasional bullish moves should meet initial barrier at the interim 55-day SMA of 0.6663 ahead of the July high of 0.6798 (July 8), and the December 2023 top of 0.6871.
Overall, the uptrend should hold as long as the AUD/USD remains above the 200-day SMA.
The 4-hour chart shows a rapid escalation in the negative bias. Against that, immediate support emerges at 0.6611 ahead of 0.6585. On the upside, the first obstacle is the 200-SMA of 0.6678, seconded by 0.6754 and ultimately 0.6798. The RSI decreased to around 17.
Premium
You have reached your limit of 3 free articles for this month.
Start your subscription and get access to all our original articles.
Author

Pablo Piovano
FXStreet
Born and bred in Argentina, Pablo has been carrying on with his passion for FX markets and trading since his first college years.


