|

AUD/USD Forecast: Can bulls defend the 0.7000 threshold?

AUD/USD Current Price: 0.7095

  • The Australian dollar fell alongside Wall Street as investors rushed to safety.
  • The Bank of England put recession on the table and triggered panic among investors.
  • AUD/USD has trimmed most of its weekly gains after reaching a critical Fibonacci level.
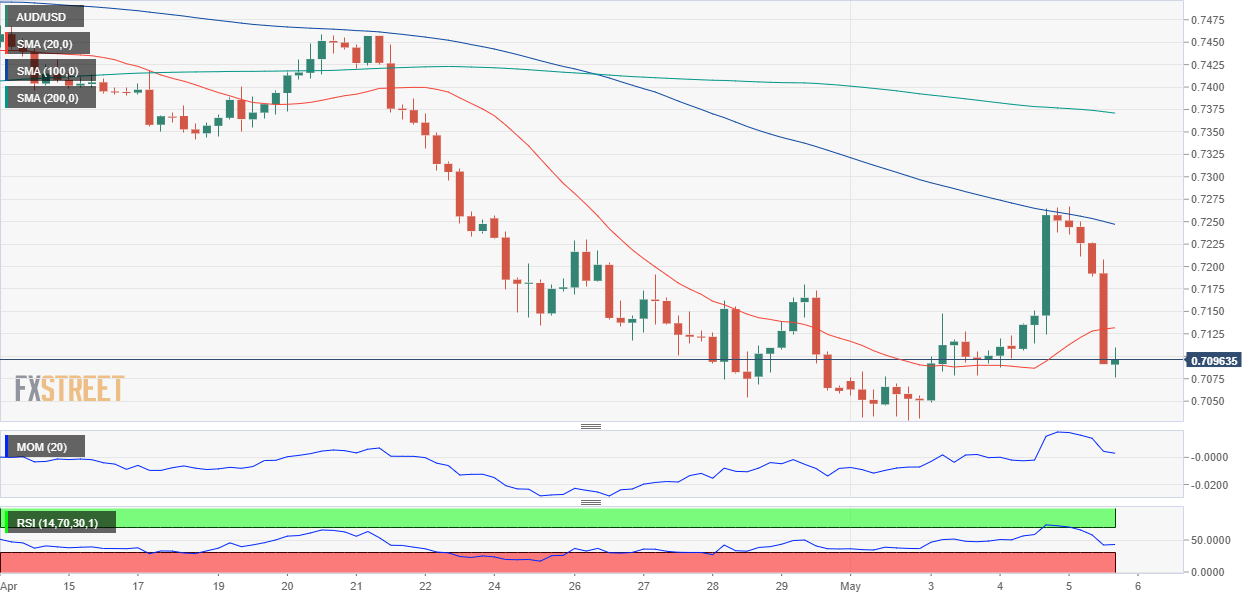
The AUD/USD pair ended the day in the 0.7090 price zone after hitting 0.7265 at the beginning of the day. The pair followed the lead of US indexes, soaring alongside Wall Street following the US Federal Reserve monetary policy decision, then plummeting on Thursday as equities collapsed. The slump in high-yielding assets came after the Bank of England warned that the UK could fall into recession this year and raised the main benchmark rate by 25 bps, reviving speculative interest fears. Government bond yields soared, dragging the American dollar alongside.

Australian data came in mixed. March Building Permits were down 18.5% MoM, much worse than anticipated, but the Trade Balance for the same month posted a surplus of 9,314 million, beating expectations. Australia will publish the April AIG Performance of Services Index, previously at 56.2. Also, the Reserve Bank of Australia will publish the Monetary Policy Statement.

AUD/USD short-term technical outlook

The AUD/USD pair topped for a second consecutive day just ahead of the 38.2% retracement of its latest daily slump measured between 0.7660 and 0.7029 at 0.7270. The daily chart shows that the 20 SMA heads firmly lower and is currently crossing below the longer ones, which remain directionless. Technical indicators have resumed their declines within negative levels after correcting oversold conditions, in line with another leg south.

The pair turned bearish in the 4-hour chart. After meeting sellers around a bearish 100 SMA, AUD/USD also settled below the 20 SMA. At the same time, technical indicators have retreated from overbought readings and currently consolidate within negative levels. A break through the base of the Fibonacci decline exposes the year low at 0.6966, with lower lows in sight for the upcoming sessions.

Support levels: 0.7030 0.7000 0.6965

Resistance levels: 0.7120 0.7165 0.7210

View Live Chart for the AUD/USD

Author

Valeria Bednarik

Valeria Bednarik was born and lives in Buenos Aires, Argentina. Her passion for math and numbers pushed her into studying economics in her younger years.


More from Valeria Bednarik
Share:

Editor's Picks

AUD/USD flirts with 0.7000, lowest since early August amid bullish USD

AUD/USD hits a fresh low since early August during the Asian session on Friday and looks vulnerable near 0.7000 after breaking below the 200-day SMA overnight. Against the backdrop of the hawkish Fed, a two-day rally in oil prices revives inflation fears and continues to push US bond yields to multi-year highs. Adding to this, geopolitical risks lift the US Dollar to a two-month high, overshadowing RBA rate hike bets and weighing on the pair.

USD/JPY pulls back from three-week high after failing near 159.00

USD/JPY edges lower during the Asian session on Friday, stalling its recent strong move to a three-week high of 159.00 as Japanese Yen bears turn cautious amid intervention fears. Meanwhile, the US Dollar retains a strong bullish undertone as the Fed's hawkish outlook and oil-driven inflation fears continue to push US bond yields to multi-year peaks. Furthermore, the BoJ's dovish rate hike last week might cap JPY and support spot prices.

Gold treads water below $4,300

Gold grabs some buying attention and advances marginally at the end of the week, partially retracing the weekly decline, although it is still navigating below the key $4,300 mark per troy ounce. The fresh selling bias on the Greenback and the modest decline in US Treasury yields appear to support the humble advance in the precious metal.

Crypto Today: Bitcoin and Ethereum edge lower, XRP extends recovery as macro headwinds weigh

The broader cryptocurrency market is consolidating on Friday, with Bitcoin paring losses slightly above $84,000. Ethereum declines in tandem with BTC. Ripple (XRP), meanwhile, paints a different picture.


Fed vs BoJ: Both hiked. The market only believes one of them – and the chart shows which
The Federal Reserve (Fed) and the Bank of Japan (BoJ) have just done something remarkably similar. Both central banks raised interest rates by 25 basis points (bps) last week, both are confronting inflation risks, and both signal that future decisions will depend on incoming economic data.
Fed vs BoJ: Both hiked. The market only believes one of them – and the chart shows which

The Fed and the BoJ have just done something remarkably similar. Both central banks raised interest rates by 25 bps last week, both are confronting inflation risks, and both signal that future decisions will depend on incoming economic data.













