AUD/USD Bullish Wave-C Runs Into 50% Fibonacci

AUD/USD seems to be completing a bullish wave 4 (blue) retracement within a larger downtrend. Today’s wave analysis reviews when the wave 4 pattern is likely to be completed.
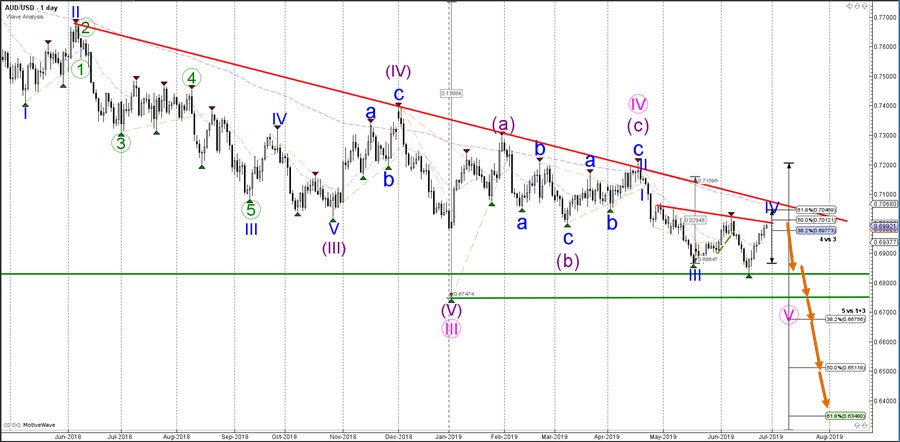
AUD/USD
Daily
The AUD/USD bullish price action will soon run into resistance trend lines (red) and the previous top (orange box), which is a confluence of resistance where price is expected to bounce. The bearish bounce could turn into a larger bearish reversal and restart the larger downtrend. The targets are indicated by the Fibonacci levels of wave 5 vs 1+3 but price needs to break the previous bottoms first.
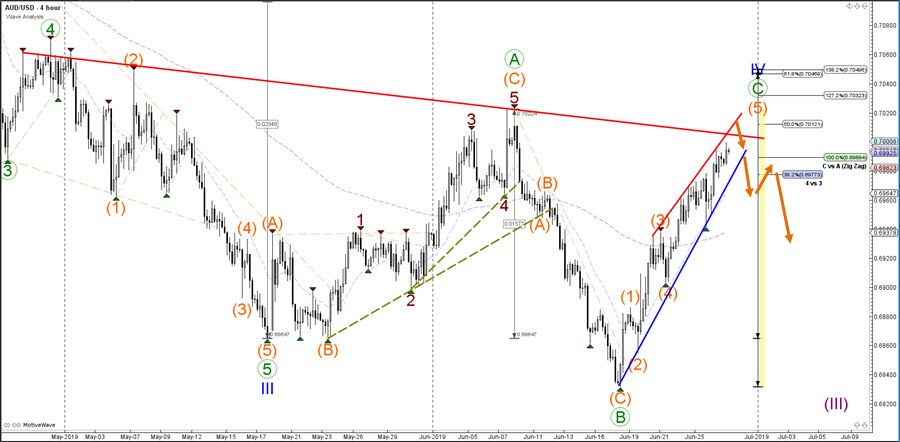
4 hour
The AUD/USD seems to be completing a bullish wave 5 (orange) pattern within a larger bullish ABC (green) zigzag pattern. If that is true, price should show a bearish bounce soon around the 50% Fibonacci retracement level. The confirmation of a bearish reversal takes place if price is able to break below the support trend line (blue).
The analysis has been done with the CAMMACD.MTF template.
For more daily technical and wave analysis and updates, sign-up up to our ecs.LIVE channel.
Author

Chris Svorcik
Elite CurrenSea
Experience Chris Svorcik has co-founded Elite CurrenSea in 2014 together with Nenad Kerkez, aka Tarantula FX. Chris is a technical analyst, wave analyst, trader, writer, educator, webinar speaker, and seminar speaker of the financial markets.


