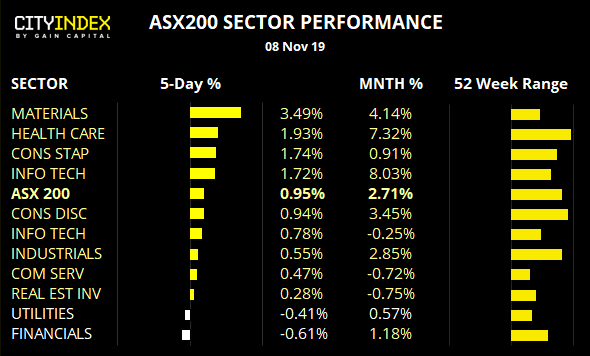
ASX200: The Long And Short Of It XJO, NAN, NCM, BOQ, GNC

A lacklustre finish for the week puts a potential head and shoulders top in focus for ASX200. We also flag a few equities we're monitoring for breakouts.
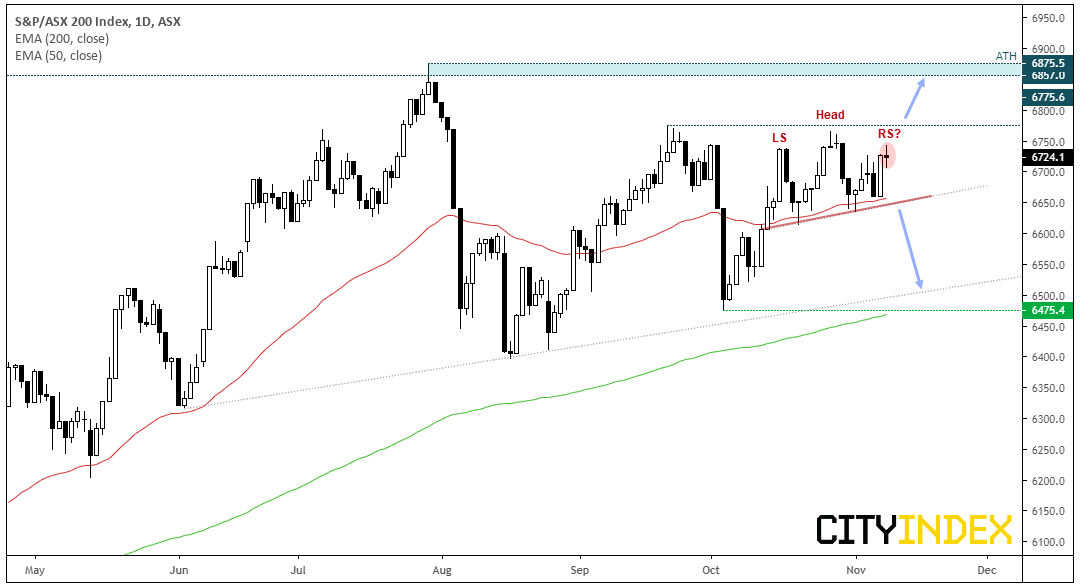
Australia 200 CFD/DFT: The index can’t quite manage to test 6,800, let alone break above it. And this is despite global equities hitting record highs and the US-China trade deal seemingly back on again. Price action has found support above the 50-day eMA, yet it hesitancy to retest 6775.6 resistance should concern the bull-camp. Moreover, a potential head and shoulders top could be forming which, if successful, projects a bearish target around 6,500.
-
Bulls could look to buy dips above the 50-day eMA if their bias is for an eventual break above 6775.6. Alternatively wait for this key level to break.
-
Bears could wait for a break of the neckline to confirm the head and shoulders top and target the lows around 6,500.
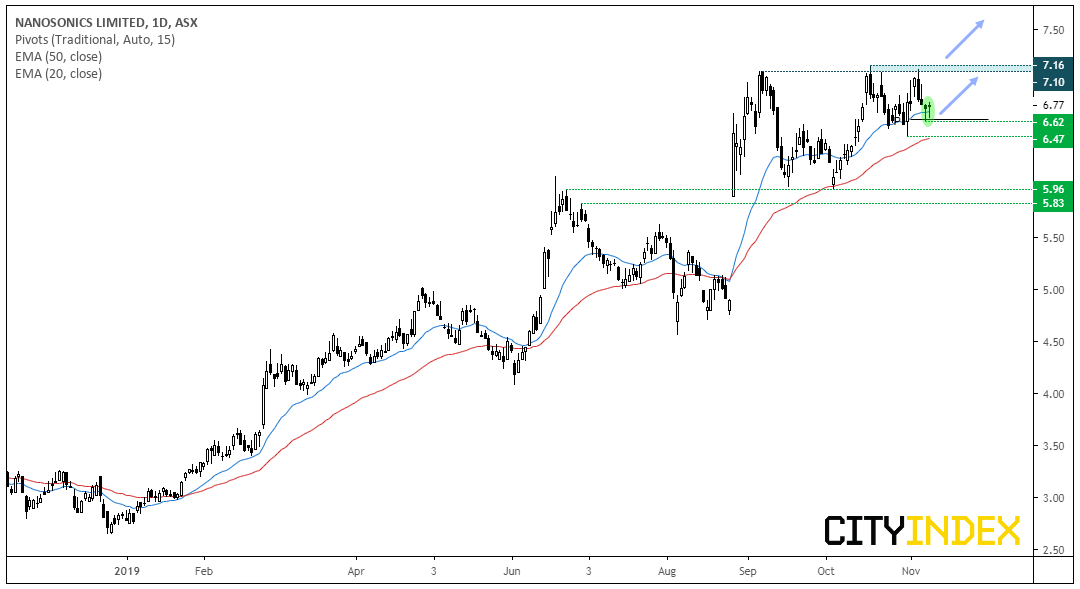
Nanosonic CFD/DFT: Up over 140% YTD and in the strongest sector YTD (health care), we’re now waiting for a bullish breakout. Price action is bobbing along the 50 and 20-day eMA’s and a series of higher highs have formed into resistance, since it gapped higher late August. Whilst its reminiscent of a cup and handle pattern, it could also transform into an ascending triangle.
-
Bulls could wait for a break above 7.16 to confirm a bullish continuation pattern.
-
Alternatively, bullish swing traders could look to anticipate the breakout whist prices hold above the monthly pivot (around 662).
-
As it trades at record highs, an open upside target can be used.
-
A break below 6.47 places it onto the backburner.
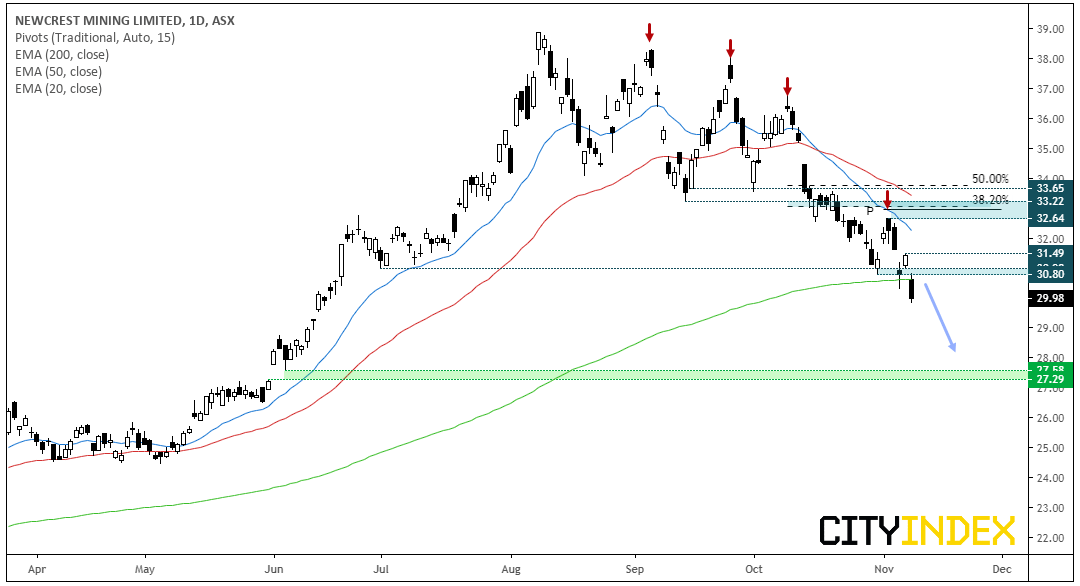
Newcrest Mining CFD/DFT: We flagged this last Friday and said “Newcrest is one to consider if the lust for gold fizzles out”. Well, gold failed to break key resistance and rolled over in style, taking gold miners with it.
It’s rebound didn’t quite make the resistance zone but a clear swing high son at 32.64. The 20-day eMA is beneath the 50 and both point lower, and prices have broken through key support and the 200-day eMA.
-
Daily trend remains bearish below 32.64, although the resistance zone around 30.60-31.00 could be used to aid with tighter risk management for bears. There’s also a swing high near 31.50 to consider, for a slightly more conservative swing trade.
-
Bears could target the gap around 27.29-27.58 whilst prices remain below the resistance area of their choice.
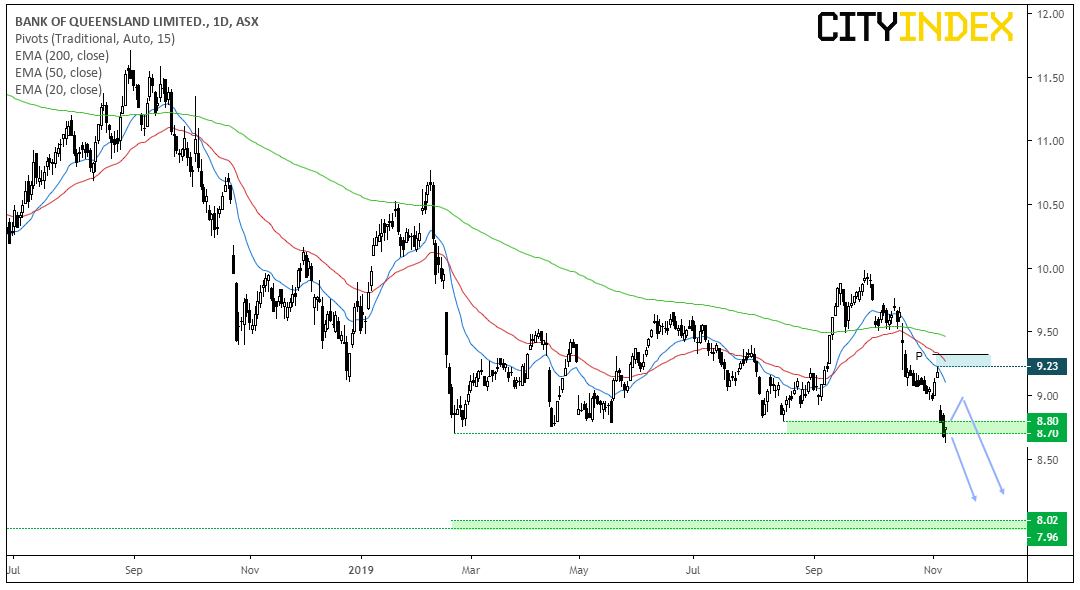
Bank of Queensland CFD: You need to really stand back to appreciate this one, as the its part of a longer-term bearish trend that began in 2017. There’s clearly a battle around the 8.70-8.80 area, although bulls do appear to be on the back foot this time around. After its 9.23 swing high, it gapped notably lower and heavy volume selling took over. Sure, its clinging on to key support now but, given the strength of bearish momentum leading prices here, at best it might achieve a minor bounce before rolling over.
-
The bias remains for a bearish breakdown whilst 9.23 caps as resistance, although there is potential for a minor recovery first.
-
Counter-trend bulls could look for longs from the monthly S1 level and target somewhere within the gap.
-
Bears could look to fade into area of weakness is it bounces from current lows. Or bears could simply trade a break of new lows.
-
Bearish target is around $8.00.
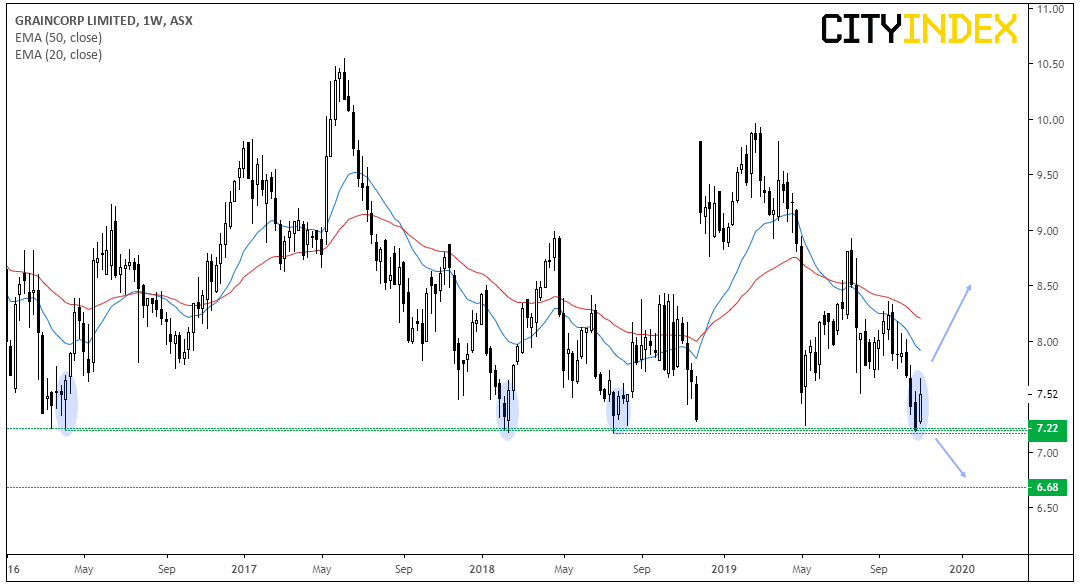
Graincorp CFD: Another chart that requires standing back to appreciate the view. Only this time, we’ve switched to the weekly chart to show how robust the 7.17-7.22 support area has been (although it has held since 2011).
Given this key support level has provided bullish rallies in excess of 35% in the past, then bears may have their work cut out. But if the level breaks, then it would be a significant event indeed.
-
A bullish weekly candle has formed above support with a higher low. Bulls could look to enter long on the daily chart with a relatively wide stop / small position and anticipated support hold and seek to scale into the position if it rebounds like it has in the past.
-
Bears could seek to enter a break of key support, or wait to see if it caps as resistance following a breakdown.
Author

Matt Simpson, CFTe, MSTA
CityIndex
Matt Simpson is a certified technical analyst who combines charts and fundamentals to generate trading themes.


