As suggested the market's traded mixed

USD: Sept '25 is Down at 96.905.
Energies: Aug '25 Crude is Up at 65.20.
Financials: The Sep '25 30 Year T-Bond is Higher by 8 ticks and trading at 114.25.
Indices: The Jun '25 S&P 500 emini ES contract is 92 ticks Higher and trading at 6170.00.
Gold: The Aug'25 Gold contract is trading Up at 3354.40.
Initial conclusion
This is not a correlated market. The USD is Down and Crude is Up which is normal, but the 30 Year T-Bond is trading fractionally Higher. The Financials should always correlate with the US dollar such that if the dollar is Higher, then the bonds should follow and vice-versa. The S&P is Higher and Crude is trading Higher which is not correlated. Gold is trading Higher which is correlated with the US dollar trading Down. I tend to believe that Gold has an inverse relationship with the US Dollar as when the US Dollar is down, Gold tends to rise in value and vice-versa. Think of it as a seesaw, when one is up the other should be down. I point this out to you to make you aware that when we don't have a correlated market, it means something is wrong. As traders you need to be aware of this and proceed with your eyes wide open. All of Asia traded Higher. All of Europe is trading Higher as well.
Possible challenges to traders
-
Final GDP q/q is out at 8:30 AM EST. This is Major.
-
Final GDP Price Index q/q is out at 8:30 AM EST. This is Major.
-
Core Durable Goods is out at 8:30 AM EST. This is Major.
-
Durable Goods is out at 8:30 AM EST. This is Major.
-
Unemployment Claims is out at 8:30 AM EST. This is Major.
-
Goods Trade Balance is out at 8:30 AM EST. This is Major.
-
Prelim Wholesale Inventories m/m is out at 8:30 AM EST. This is Major.
-
FOMC Member Barkin Speaks at 8:45 AM EST. This is Major.
-
FOMC Member Hammack Speaks at 9 AM EST. This is Major.
-
Pending Home Sales is out at 10 AM EST. This is Major.
-
Natural Gas Storage is out at 10:30 AM EST. This is Major.
-
FOMC Member Barr Speaks at 1:15 PM EST. This is Major.
Traders, please note that we've changed the Bond instrument from the 10 Year (ZN) to the 2 Year (ZT). They work exactly the same.
We've elected to switch gears a bit and show correlation between the 2-year Treasury notes (ZT) and the S&P futures contract. The YM contract is the Dow Jones Industrial Average, and the purpose is to show reverse correlation between the two instruments. Remember it's likened to a seesaw, when up goes up the other should go down and vice versa.
Yesterday the ZT climbed Higher at around 7:30 AM EST with no news pending. The Dow dived Lower at the same time. Look at the charts below and you'll see a pattern for both assets. The Dow dived Lower at 7:30 AM EST and the ZT climbed Higher at around the same time. These charts represent the newest version of Bar Charts, and I've changed the timeframe to a 15-minute chart to display better. This represented a Long opportunity on the 2-year note, as a trader you could have netted about a dozen ticks per contract on this trade. Each tick is worth $6.25. Please note: the front month for ZT is now Sep '25 and the Dow is now Sep '25. I've changed the format to filled Candlesticks (not hollow) such that it may be more apparent and visible.
Charts courtesy of BarCharts
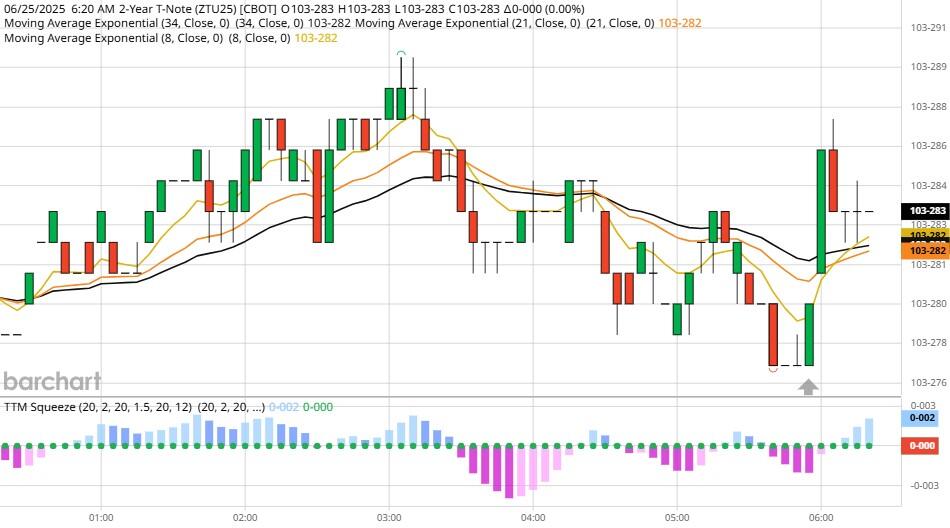
ZT -Sep 25 - 6/25/25
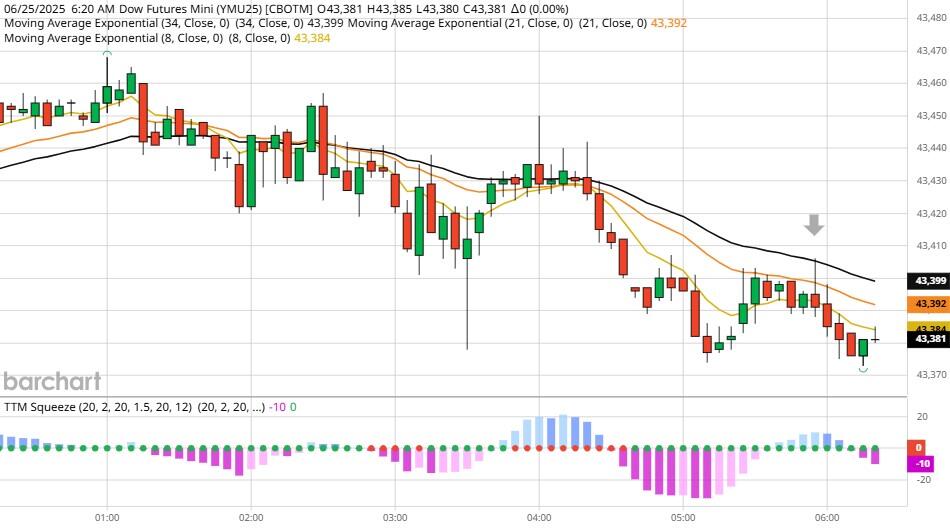
Dow - Sep 2025- 6/25/25
Bias
Yesterday we gave the markets a Mixed bias and the indices didn't disappoint. The Dow dropped 107 points, the S&P lost about one point, but the Nasdaq closed Higher. All in all, a Mixed day as suggested. Today we aren't dealing with a correlated and will maintain a Neutral or Mixed bias.
Could this change? Of Course. Remember anything can happen in a volatile market.
Commentary
Yesterday the news was ablaze with news that the US air raids over Iran this past weekend didn't completely destroy all of Iran's nuclear capability. This threw the market in a bit of a tailspin but nothing dramatic. As suggested the market's traded Mixed. Want to learn Market Correlation and determine market direction hours before the Opening Bell?
Author

Nick Mastrandrea
Market Tea Leaves


