Are we in the midst of a regime change?

Going into last week, US equity bears were vocal and active; more importantly, they were aggressive in their positioning. Perhaps their complacency and overconfidence opened the door for the largest weekly S&P 500 rally in over a year. The shift from doom and gloom to optimism was violent and has likely altered the mindset of many market participants.
Specifically, the collapse in the VIX (CBOE Volatility Index), which measures the implied volatility in the S&P 500 options market, suggests we are witnessing a regime change from an environment of high volatility sell-offs to a slower-paced grind higher. Implied volatility is the amount of premium speculators or hedgers are willing to pay for put exposure. Thus, it makes sense that it is often referred to as the fear index; spooked investors are willing to pay more for portfolio protection. The implosion of this premium is a tell-tale sign of a shift in sentiment that should favor the bull camp.
In addition to a change in volatility, we appear to be in store for a regime change in monetary policy. The Federal Reserve has yet to close the door on another interest rate hike, but the US Central Bank has made it clear that they recognize the risk of going too far and respect that. Of course, many believe that line in the sand has already been surpassed. All data is lagging by nature, but the Fed is looking at wildly lagging data due to its focus on moving averages. Thus, the odds of overshooting interest rate policy are significant. This theory has been proven multiple times, the most recent being the lower-for-longer interest rate policy during the Covid-era that eventually contributed to historic inflation levels.
To be frank, we believe the shift from high to low volatility has been in the works for some time (since the October 2022 lows), and we are at the tail end of the process. Perhaps the most recent correction was the last chance for the bears to capitalize on the fear of higher rates, political turmoil, etc. As a result, we expect price changes to be far less dramatic going forward. This means slower and shorter rallies followed by measured and shallow corrections and a VIX spending most of its time at or below 15.00.
S&P 500 weekly chart
Taking a step back from the day-to-day talking points to look at a weekly chart of the E-mini S&P 500, we see a market that has rejected its 50-week moving average and closed favorably over a pivot line. If this line near 4330 continues to hold gains, the bulls are in control with strong odds of a run into the low 4700s. In addition to a charting advantage, the bulls also have a tailwind in the form of bullish seasonality working in their favor. The next seasonal bullish push starts on or about November 20th through the first week of December, then fires up again from Christmas through New Year’s Day.
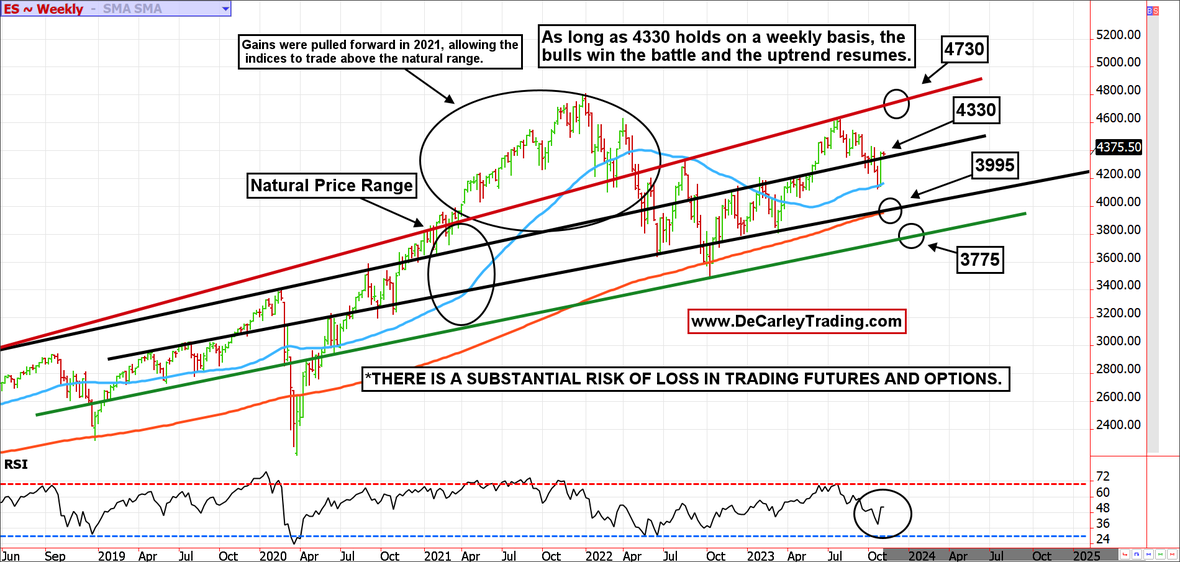
The RSI (Relative Strength Index) has been making its way higher, and if prices succumb to the guidance offered by the natural trading range, we should see a return to 4730 in the S&P 500. We define the natural trading range between the red resistance line and the green support line on the accompanying chart. For now, the top of the range is 4730, and the bottom is 3775. Obviously, this is a relatively wide price span, but that’s how financial markets operate. In a shorter time frame, the bulls should look for a pullback to 4330ish to prove itself.
Although we deem this to be the market’s natural trajectory due to trendlines and the expected slope, we’ve witnessed some extreme breaches. Taper Tantrum 2.0 in late 2018 and the COVID shutdown of March 2020 resulted in downside breakouts. Conversely, the massive COVID-related stimulus and lower-for-longer interest rate policy irrationally enabled the equity market to pull forward gains in 2021, forcing the S&P 500 well above its natural price envelope. It is no coincidence the market finds itself near the middle of that natural range.
Another takeaway from this chart is the overall direction of the index. The definition of a bull market is higher highs and higher lows. While we have yet to overcome the all-time high (made artificially early due to stimulus), we have consistently made lower lows. Even if we see a test of the lower level of the channel at 3775, that statement would hold true, this a bull market, folks.
Author

Carley Garner
DeCarley Trading
Carley Garner is an experienced commodity broker with DeCarley Trading, a division of Zaner, in Las Vegas, Nevada. She is also the author of multiple books including, “Higher Probability Commodity Trading” and “A Trader's First Book on Commodities”.


