Market profile analysis: Intraday trade idea for US index futures

For traders who love the US markets and like to keep and eye on the future associated with the markets in the US, we urge that you take a careful look at the Russell futures today which appear to be in a bottom formation. However if there is a profit-taking session which ensues today, we could more than likely break lower below initial support for the Russell. We present our intraday trade idea for US index futures below along with our Market Profile Analysis:
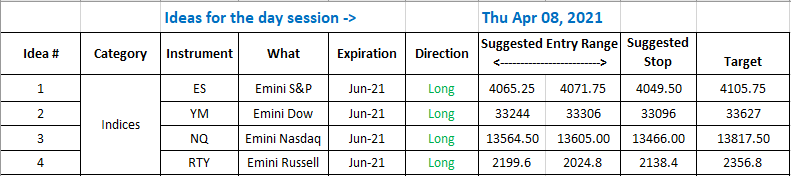
Trade idea
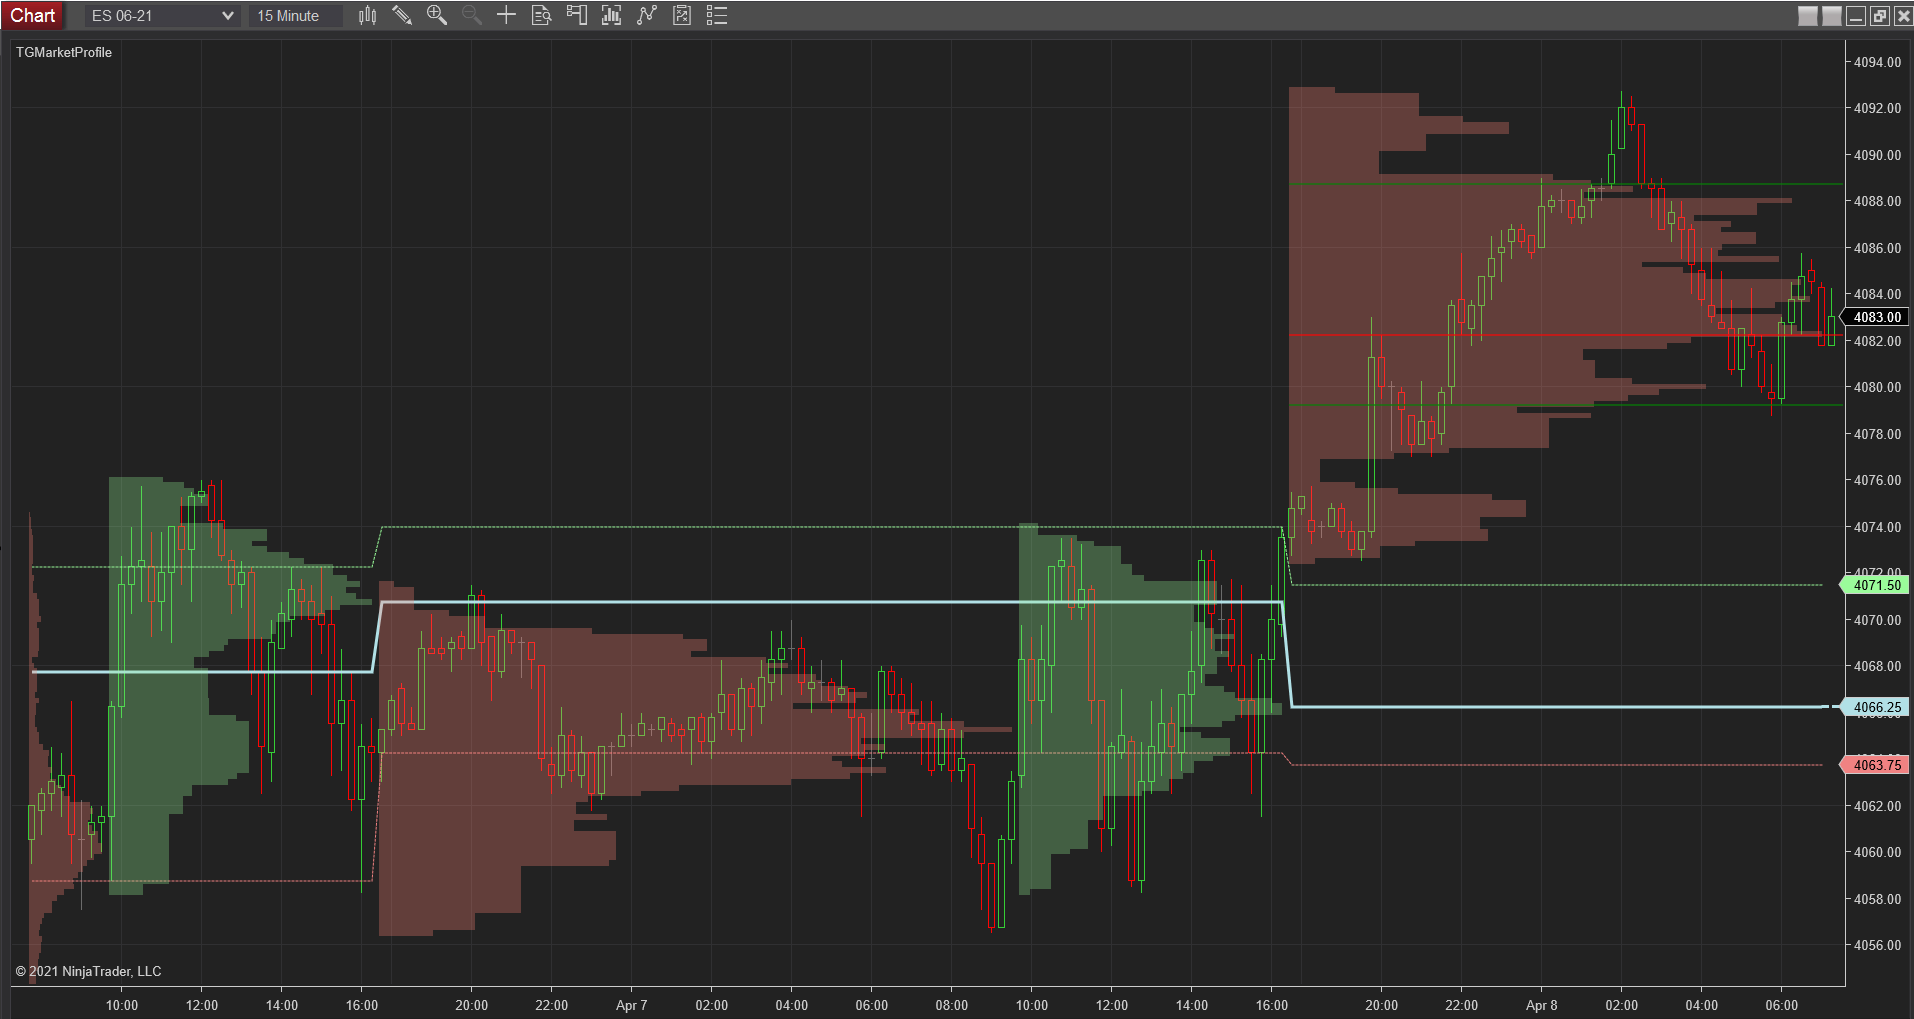
Market profile analysis
Take a careful look at the market profile map shown below and tell me if you can discern anything unusual? What I see initially is that despite the ON squeeze higher into and past 4090 [we clocked ON high of 4092.75], the POC moved lower from yesterday now to 4066.25. It is a rather unusual thing and usually is accompanied by a liquidation break, so I would be watchful and take smaller duration trades when trading long today. Unlike Monday’s premarket, there are no “poor highs” in today's distribution but there are longs between about 4085 and 4092.75 who are currently trapped, so in the event that we do revisit the ON high during the RTH, expect some of those traders to try and break even causing some selling on initial touch.
ON inventory is net long from last evening’s settlement, so that continues to be a takeaway each day. The Russell remains the weak link and now the YM appears to be wanting to tag-team RTY as it has been weaker than the ES and NQ. There are low volume nodes at 4076 and 4072 so expect some reaction there and obviously some traders wanting to join the overnight distribution down there if we do happen to pull back here in the early session. Today in terms of the Economic Calendar, we have Nat Gas storage numbers from the EIA at 10:30 am and the big one is Chair Powell’s speech at noon, so please expect turbulence leading into and past the noon hour.
Scenarios
-
Initial support sits at 4069.25, if we dropped below 4077.75 into the open, expect that initial support area to more than likely, hold up well. Below 4069.25 there is but thin support un until 4057.75 which also provided good support during the RTH session yesterday.
-
Those of you who are long, please look for some resistance at the next psychological level of 4100 as we appear to have covered 100 points easily since the Easter break.
-
The current halfback is 4074.50 with support at 4070.25. Holding this second number for intraday Fib watchers could see us tagging 4101.50 easily.
Author

Murali Sarma
Trade Guidance, LLC
Murali Sarma is a private investor and trader, dealing in currencies, commodities (grains, energies, metals, bonds, indices) and stocks.


