AMZN Buying The Elliott Wave Dips At Blue Box Area

In this technical blog, we are going to take a look at the past performance of 4 hour Elliott Wave charts of AMZN, which we presented to members. But, firstly we need to understand the market nature that it always fights between the two sides i.e Buying and Selling. We at elliottwave-forecast.com understand the Market Nature and always recommend trading the no-enemy areas. We called blue box areas on our Charts as the no-enemy areas, which gave us the reaction in favor of market direction in 3 swings at least. Now, let us take a quick look at the AMZN Charts and structure below:
AMZN 4 Hour Elliott Wave Chart
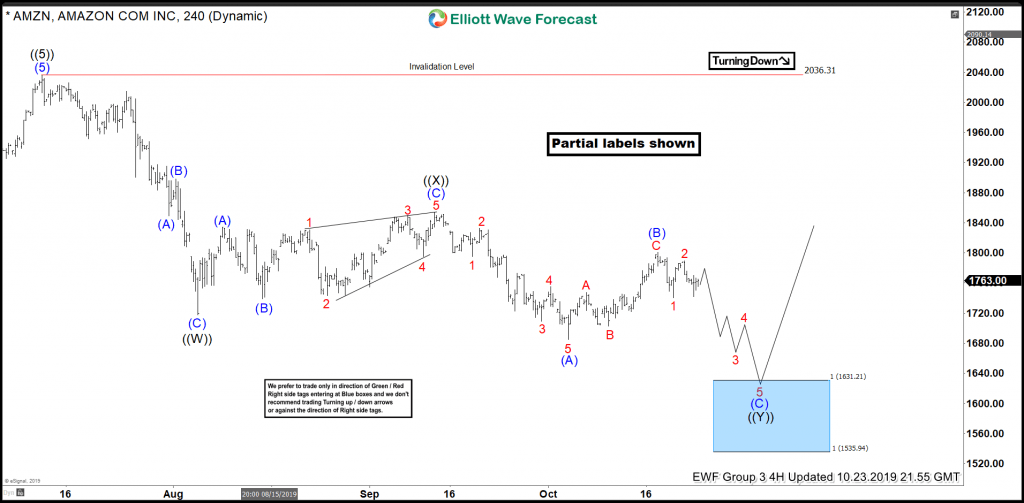
AMZN 4-hour Chart from 10/23/2019 update. In which, the rally from 12/24/2018 low ended 5 waves impulse rally at $2036.31 high seen at 7/11/2019 peak. Down from there, the stock corrected the cycle from 12/24/2018 low and made a pullback. The internals of that pullback unfolded as double three structure with the sub-division of 3-3-3 corrective structure in each leg lower. When initial decline to $1849.44 low ended wave (A), wave (B) bounce ended at $1897.92 high and wave (C) ended at $1718 low thus completed wave ((W)) as zigzag structure.
Up from there, wave ((X)) bounce also unfolded as a zigzag structure where wave (A) ended at $1834.26 high. Wave (B) ended at $1738.69 low and wave (C) ended at $1853.66 high. Down from there, wave ((Y)) lower was also expected to unfold as a zigzag structure. While the first leg lower ended in wave (A) at $1685.06 low. Wave (B) bounce ended at $1800.95 high and wave (C) was expected to reach $1631.22-$1535.94 blue box area for next buying opportunity looking for 3 wave reaction higher at least.
AMZN 4 Hour Elliott Wave Chart
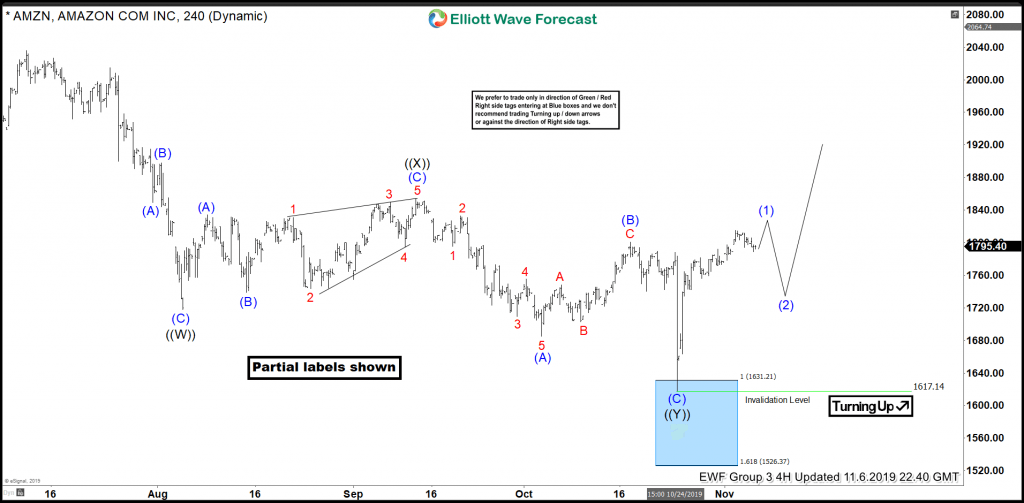
Here's a 4-hour view from 11/06/2019 update. In which, the stock managed to reach the blue box area at $1631.22-$1535.94 as expected & bounced. Allowed members to create a risk-free position shortly after taking the long opportunity. Near-term, while dips remain above $1617.14 low the stock is expected to resume the upside. However, a break above $2036.31 high still needed to confirm the next extension higher & avoid further correction lower.
Keep in mind that the market is dynamic and the view could change in the meantime. Success in trading requires proper risk and money management as well as an understanding of Elliott Wave theory, cycle analysis, and correlation. We have developed a very good trading strategy that defines the entry. Stop loss and take profit levels with high accuracy and allows you to take a risk-free position, shortly after taking it by protecting your wallet. If you want to learn all about it and become a professional trader. Then join our service by taking a Free Trial.
Author

Elliott Wave Forecast Team
ElliottWave-Forecast.com


