After three down days in a row the markets migrated to the upside

USD: Jun '24 is Up at 104.300.
Energies: Apr '24 Crude is Up at 82.17.
Financials: The June '24 30 Year T-Bond is Down 5 ticks and trading at 120.01.
Indices: The Jun '24 S&P 500 emini ES contract is 8 ticks Lower and trading at 5306.25.
Gold: The Apr'24 Gold contract is trading Up at 2233.30.
Initial conclusion
This is not a correlated market. The USD is Up and Crude is Up which is not normal, but the 30 Year T-Bond is trading Lower. The Financials should always correlate with the US dollar such that if the dollar is Higher, then the bonds should follow and vice-versa. The S&P is Lower and Crude is trading Higher which is correlated. Gold is trading Higher which is not correlated with the US dollar trading Up. I tend to believe that Gold has an inverse relationship with the US Dollar as when the US Dollar is down, Gold tends to rise in value and vice-versa. Think of it as a seesaw, when one is up the other should be down. I point this out to you to make you aware that when we don't have a correlated market, it means something is wrong. As traders you need to be aware of this and proceed with your eyes wide open. Asia is trading Mixed with half the exchanges Higher and the other half Lower. Currently all of Europe is trading Higher except the Spanish exchange.
Possible challenges to traders
Thursday, March 28th
-
Final GDP q/q is out at 8:30 AM EST. This is Major.
-
Final GDP Price Index q/q is out at 8:30 AM EST. This is Major.
-
Unemployment Claims are out at 8:30 AM EST. This is Major.
-
Chicago PMI is out at 9:45 AM EST. This is Major.
-
Pending Home Sales m/m is out at 10 AM EST. This is Major.
-
Revised UoM Consumer Sentiment is out at 10 AM EST. This is NOT Major.
-
Revised UoM Inflation Expectations is out at 10 AM EST. This is NOT Major.
-
Natural Gas Storage is out at 10:30 AM EST. This is Major.
Friday, March 29th
-
Core PCE Price Index m/m is out at 8:30 AM EST. This is Major.
-
Goods Trade Balance is out at 8:30 AM EST. This is Major.
-
Personal Income m/m is out at 8:30 AM EST. This is Major.
-
Personal Spending m/m is out at 8:30 AM EST. This is Major.
-
Prelim Wholesale Inventories m/m is out at 8:30 AM EST. This is Major.
-
FOMC Member Daly Speaks at 11:20 AM EST. This is Major.
-
Fed Chair Powell Speaks at 11:30 AM EST. This is Major.
Treasuries
Traders, please note that we've changed the Bond instrument from the 30 year (ZB) to the 10 year (ZN). They work exactly the same.
We've elected to switch gears a bit and show correlation between the 10-year bond (ZN) and the S&P futures contract. The S&P contract is the Standard and Poor's, and the purpose is to show reverse correlation between the two instruments. Remember it's likened to a seesaw, when up goes up the other should go down and vice versa.
Yesterday the ZN migrated Higher at around 10 AM EST as the S&P hit a High at around the same time. If you look at the charts below the S&P gave a signal at around 10 AM and the ZN started its Upward climb. Look at the charts below and you'll see a pattern for both assets. S&P hit a High at around 10 AM and migrated Lower. These charts represent the newest version of MultiCharts and I've changed the timeframe to a 15-minute chart to display better. This represented a Long opportunity on the 10-year note, as a trader you could have netted about a dozen plus ticks per contract on this trade. Each tick is worth $15.625. Please note: the front month for both the ZN and the S&P are now Jun '24. I've changed the format to filled Candlesticks (not hollow) such that it may be more apparent and visible.
Charts courtesy of MultiCharts built on an AMP platform
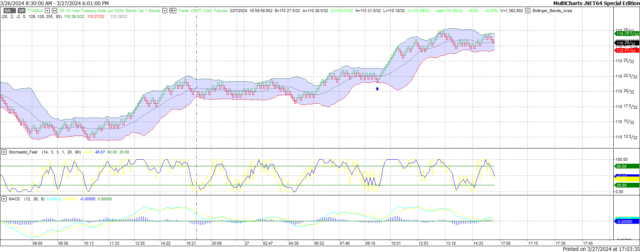
ZN -Jun 2024 - 03/27/24
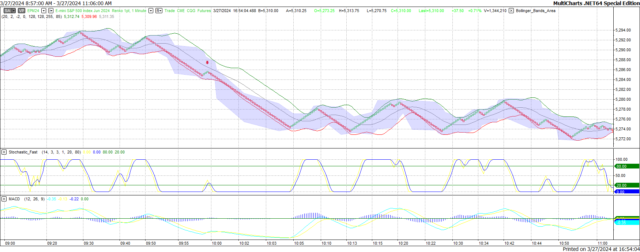
S&P - Mar 2024 - 03/27/24
Bias
Yesterday we gave the markets an Upside bias as the Bonds, Crude and the USD were trading Lower Wednesday morning and that usually reflects an Upside Day. The markets didn't disappoint as the Dow gained 478 points on the session and the other indices migrated Higher. Today we aren't dealing with a correlated market and our bias is to the Downside.
Could this change? Of course. Remember anything can happen in a volatile market.
Commentary
Finally, after 3 down days in a row the markets migrated to the Upside. Yesterday seemed more like a normal day as the Bonds, Crude and the USD all traded Lower Wednesday morning and that is indicative of an Upside Day. Today we show economic news for both Thursday and Friday even though Friday is Good Friday, and the markets are closed. I think the reason is because Friday the 29th is the last calendar day in March 2024 and they need to release all economic news prior to the end of March. I could be wrong but that's my thinking. Today we have about 7 economic reports, most of which are Major. We do wish that everyone have a safe and Happy Easter Holiday. Enjoy!!!
Author

Nick Mastrandrea
Market Tea Leaves


