A puzzling re-opening of the markets

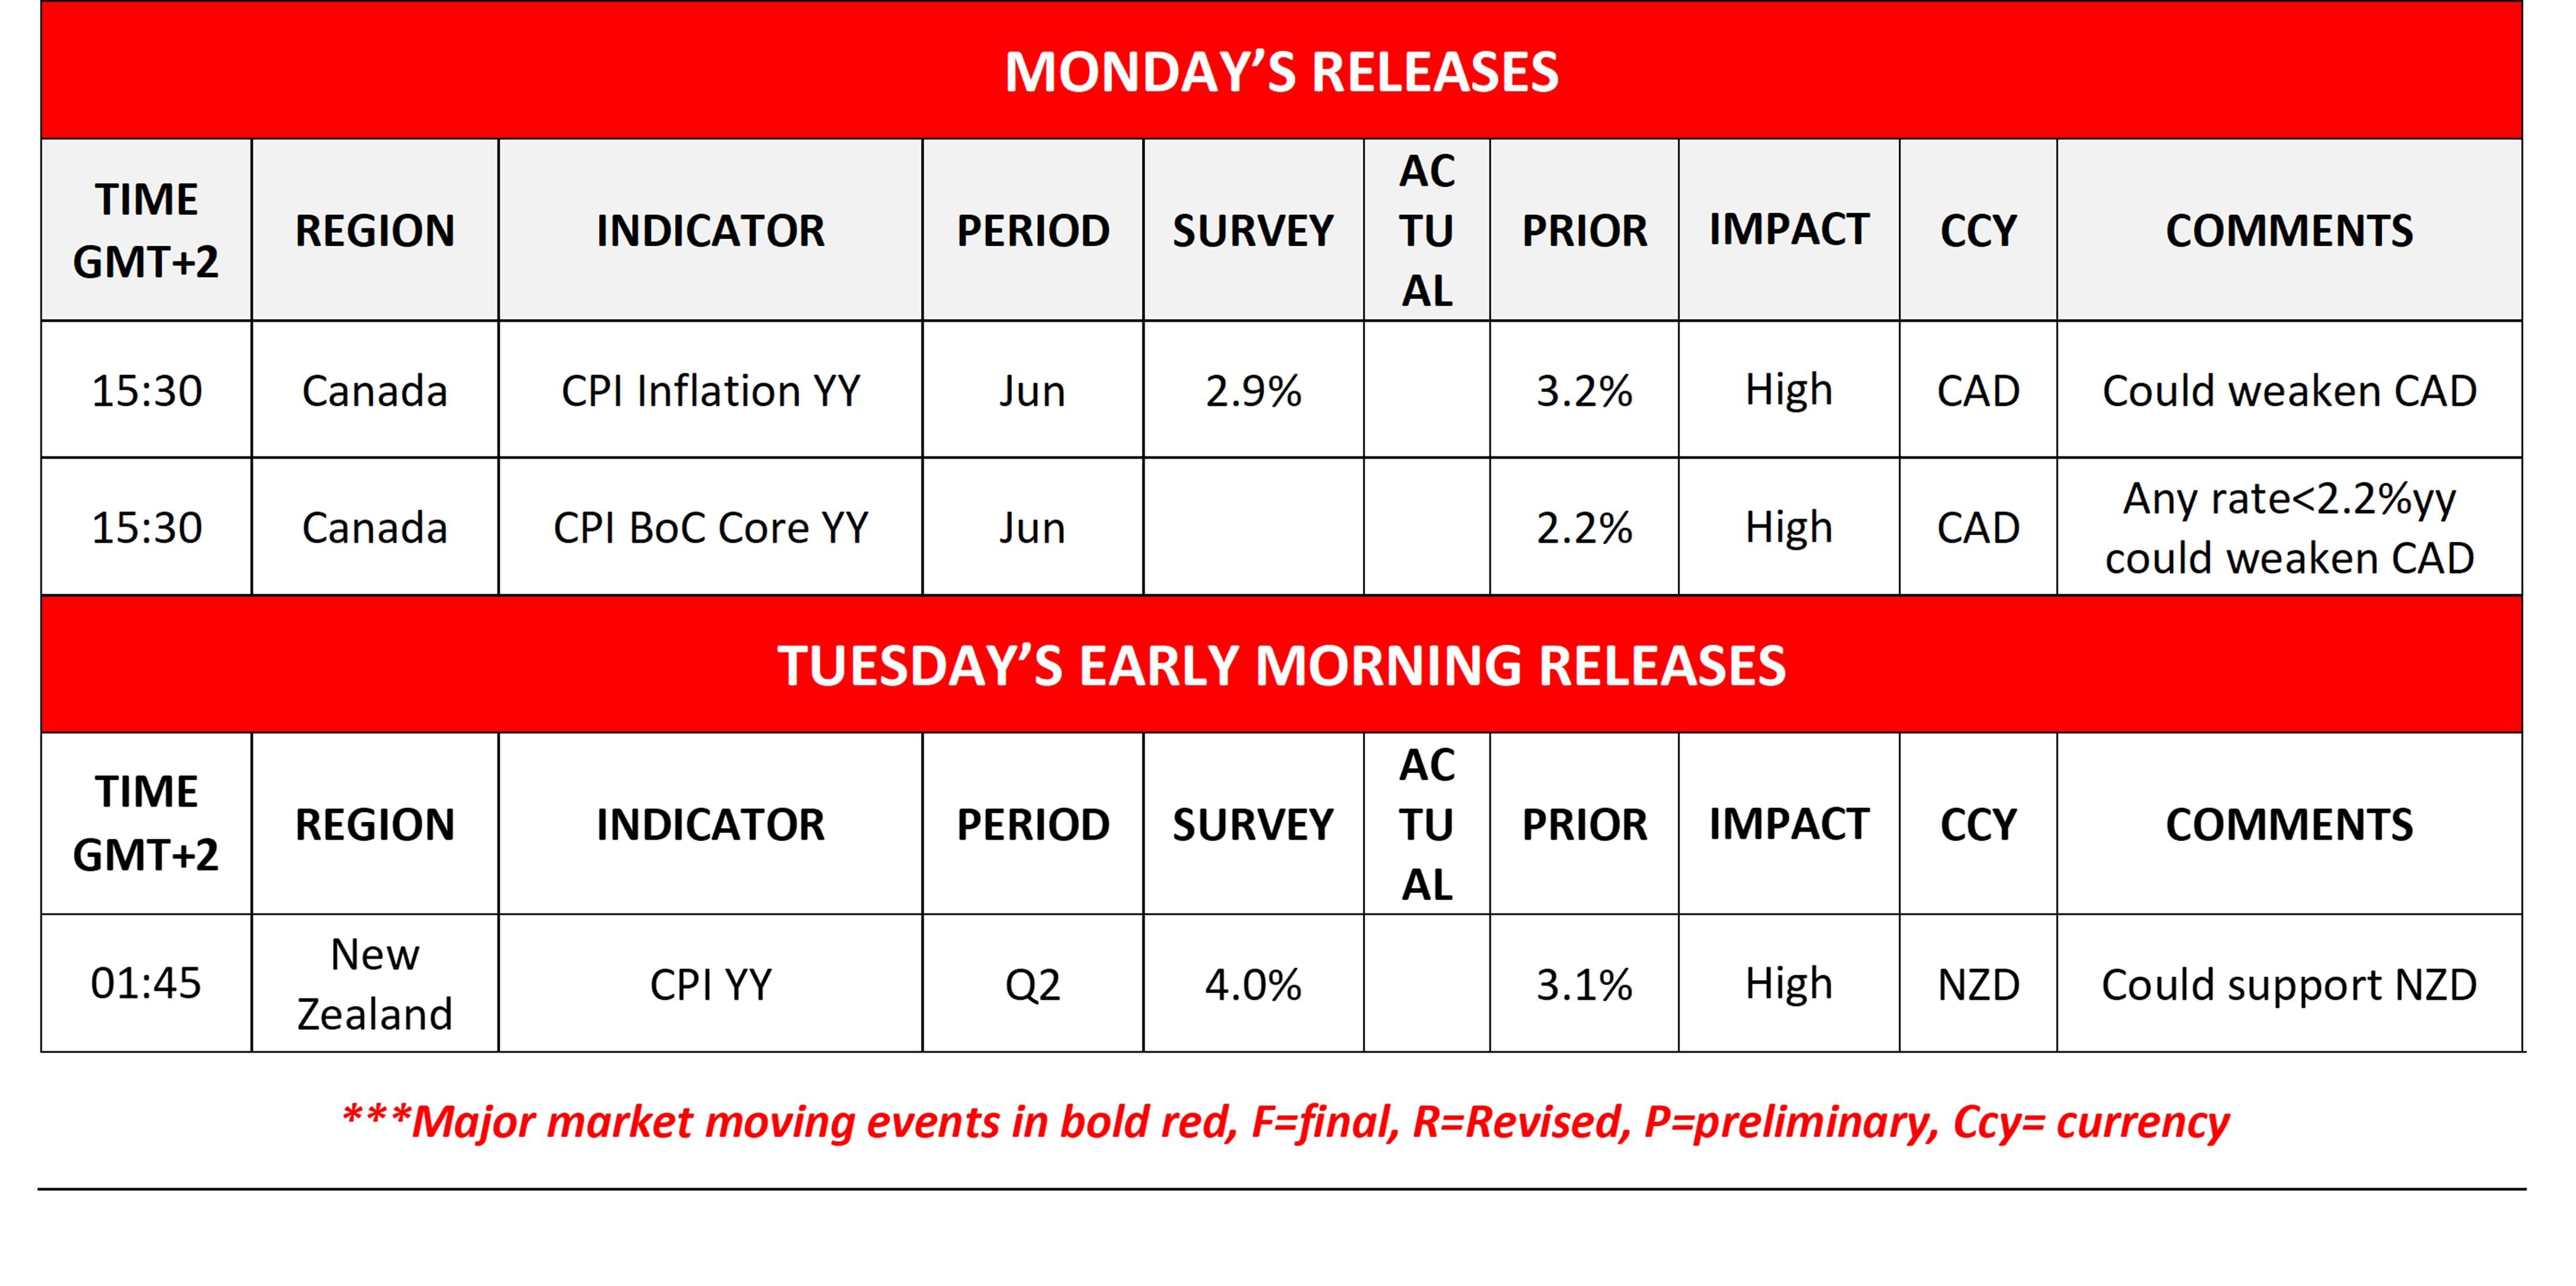
Canada’s June CPI rates in the forefront
There were mixed signals in the FX market today, with the USD possibly continuing to lead the market. With now US high-impact data releases on the calendar, we expect fundamentals to lead the markets. Yet north of the US border, we note the release of Canada’s CPI rates for June, which could move the Loonie. Should Canada’s CPI rates for June accelerate, we may see the Loonie getting some much needed support, while a possible wider than expected easing of inflationary pressures could weigh on the CAD.
Oil prices continue to rise
Oil prices continued to rise on Friday and during today’s Asian session, as oil market worries remain present for the situation in the Persian Gulf. Please note that the US and Iran exchange salvos for a ninth day in a row, practically threatening further the closure of the Straits of Hormuz, a vital oil shipping route. A possible enhancement of market worries for the issue could push oil prices even further.
Will the bearish tendencies for US equities be renewed?
US equities displayed notable bearish tendencies last week, especially in the Tech-sector. Market worries for possible overvaluations led to a correction lower, reflected mostly on stocks related to AI. As the markets restart their engines after the weekend, it remains to be seen whether the markets’ worries are maintained and able to send US stock markets lower, while a possible easing of worries could allow US equities to rise.
Other highlights for today
Today we get Canada’s CPI rates for June and in tomorrow’s Asian session we get New Zealand’s Q2 CPI rates.
As for the rest of the week
On Tuesday, we get UK’s employment data for May and Germany’s ZEW indicators for July. On Wednesday we get Japan’s trade data and UK’s CPI rates, both for June. On Thursday, we get Australia’s employment data for June, UK’s CBI trends for industrial orders for July, Canada’s retail sales for May, and the weekly initial jobless claims figure, we note Turkey’s CBT interest rate decision and from the Euro Zone, ECB’s interest rate decision. On Friday we get July’s preliminary PMI figures of Australia, Japan, France, Germany, the Euro Zone as a whole, the UK and the US. On Friday we get Japan’s CPI rates for June and UK’s retail sales also for June.
Charts to keep an eye out
USD/CAD continued to drop breaking the 1.4020 (S1) support line. We maintain a bearish outlook for the pair given its downward motion for the past week. The RSI indicator is nearing the reading of 30, signalling an intensifying bearish market sentiment that may push the pair’s price action even lower. Should the bears continue to lead the pair’s price action, we set as the next possible target the 1.3880 (S1) support level. For a bullish outlook, which we currently consider as a remote scenario, we would require the pair’s price action to break the 1.4020 (R1) resistance line and continue higher to break also the 1.4145 (R2) resistance level.
WTI’s rose on Friday and during today’s Asian session, breaking the 82.00 (S1) resistance line, now turned to support. We tend to maintain a bullish outlook for the commodity’s price as long as the upward trendline guiding it remains intact. Furthermore, we note that the RSI indicator is on the rise aiming for the reading of 50, implying an intensifying bullish market sentiment for the commodity’s price. Yet we note that WTI’s price action, has breached the upper Bollinger band, which may slow down the bulls. Should the bulls maintain control we may see WTI breaking the 88.60 (R1) resistance line, with the next possible target being set at the 93.30 (R2) resistance level. Should the bears take over, we may see WTI’s price action, breaking the 82.00 (S1) support line, continue to break also the prementioned upward trendline signaling an interruption of the upward movement and aim if not breach the 76.60 (S2) support level.
USD/CAD daily chart
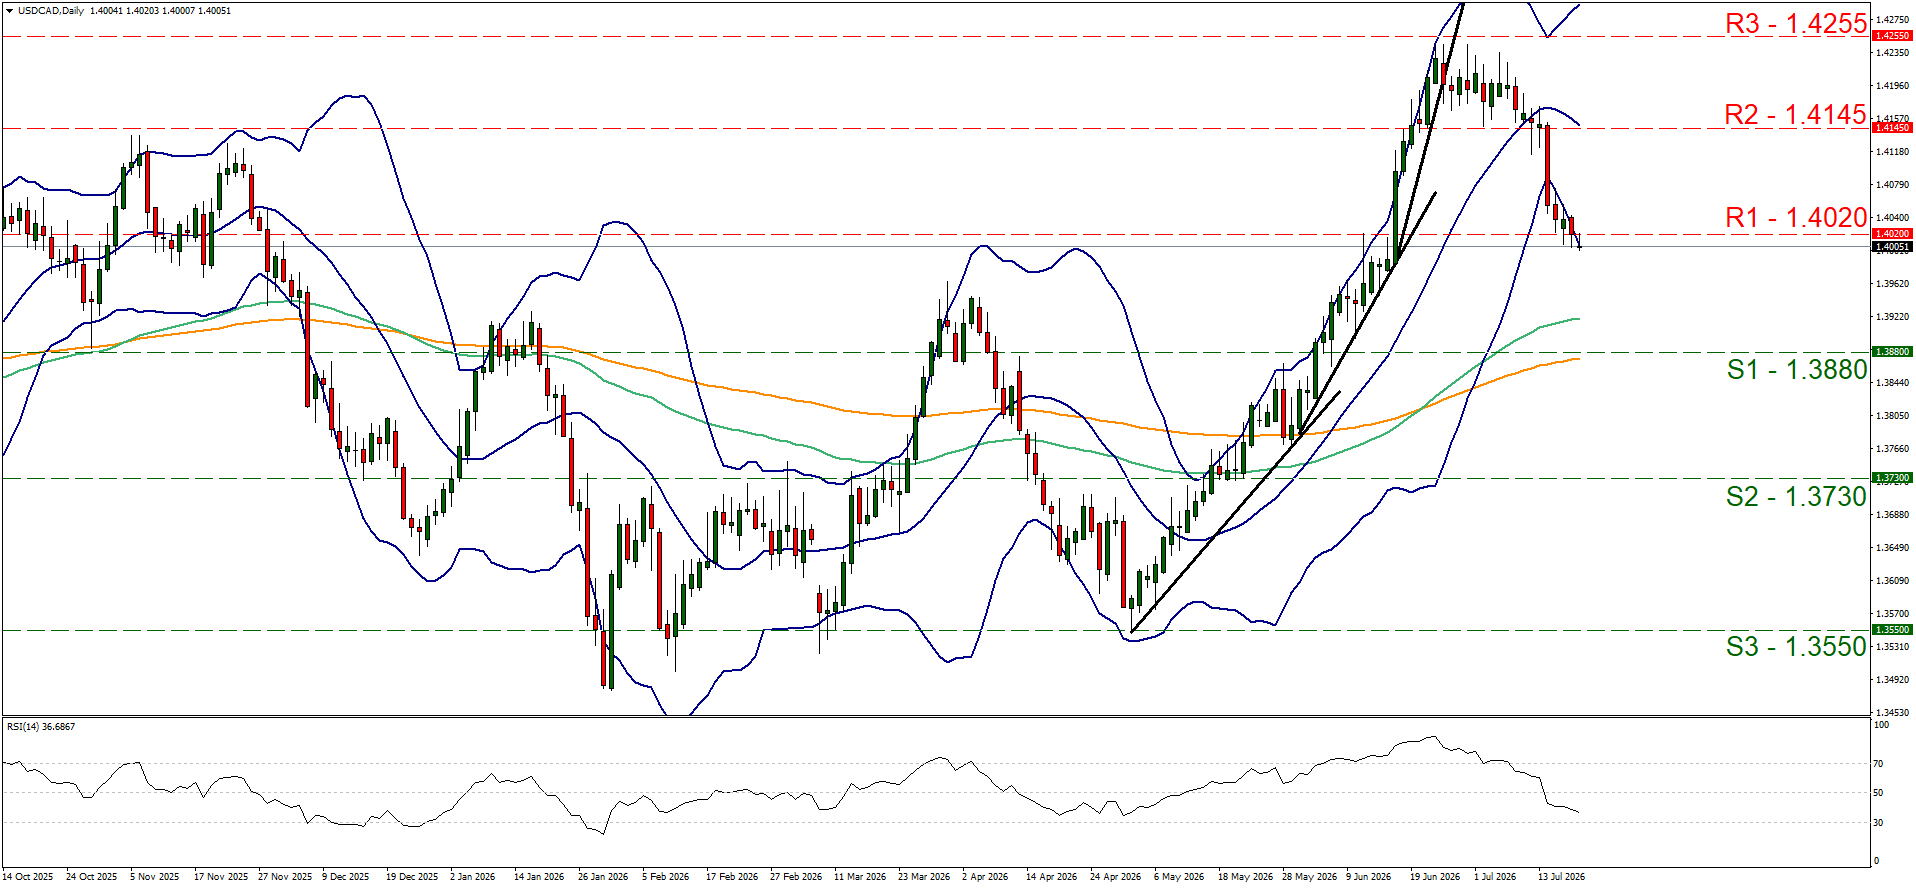
- Support: 1.3880 (S1), 1.3730 (S2), 1.3550 (S3).
- Resistance: 1.4020 (R1), 1.4145 (R2), 1.4255 (R3).
WTI daily chart
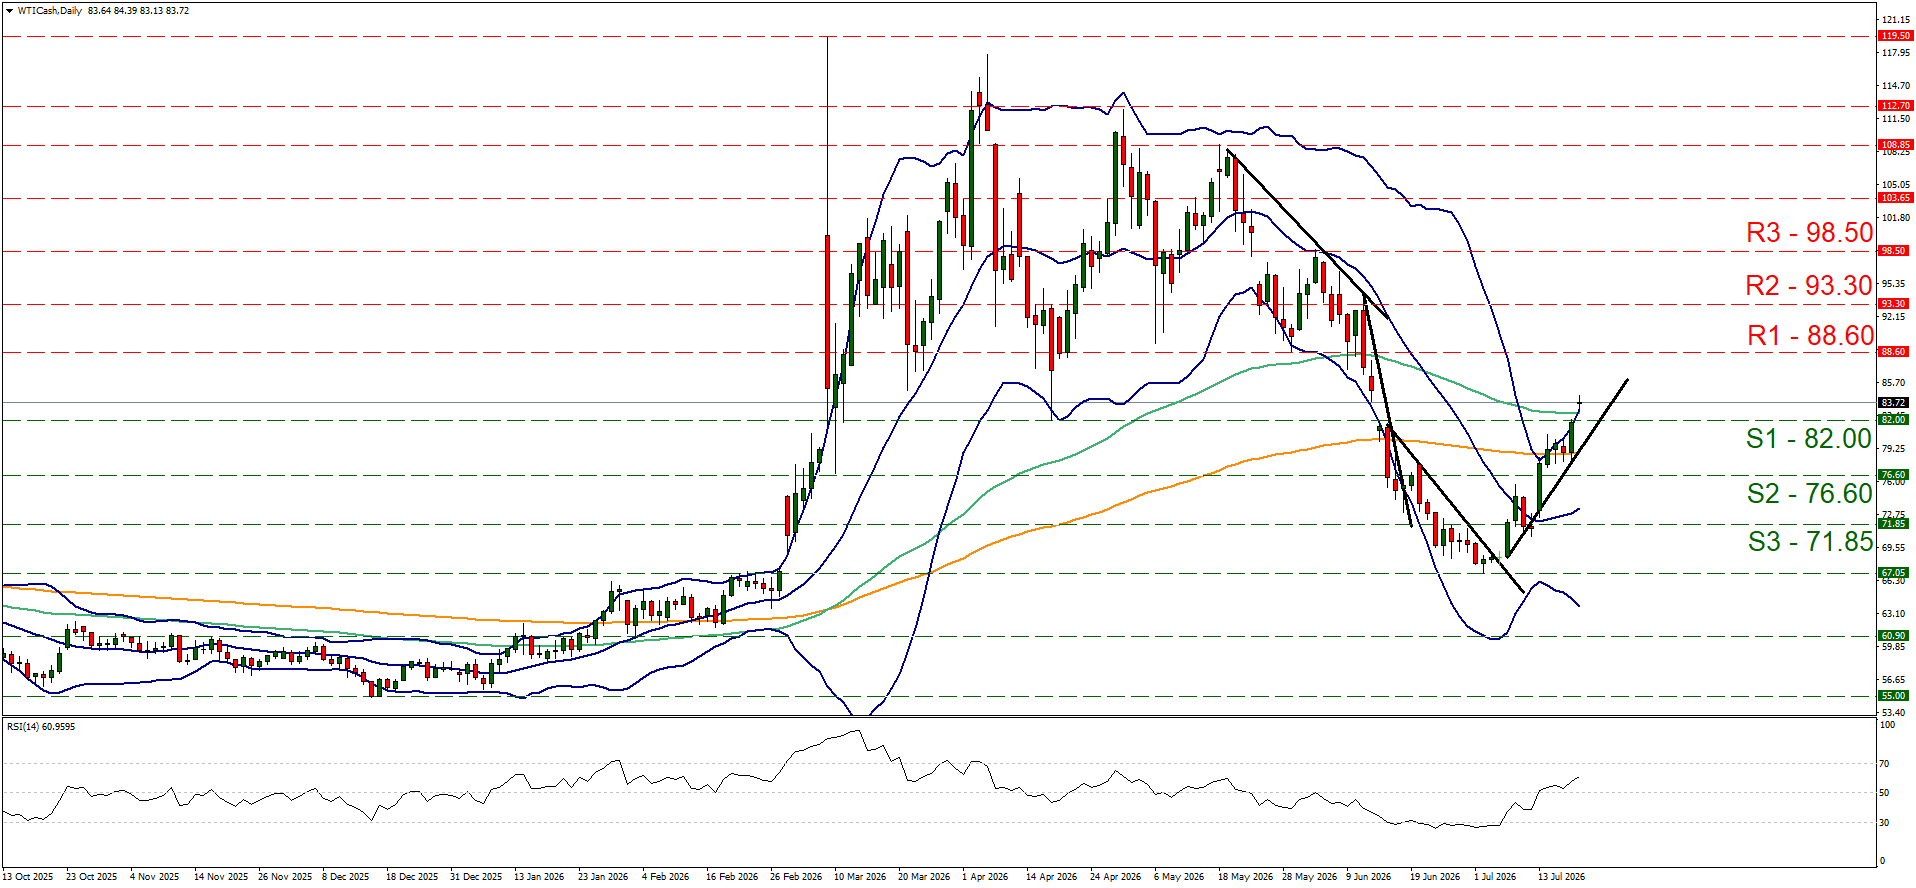
- Support: 82.00 (S1), 76.60 (S2), 71.85 (S3).
- Resistance: 88.60 (R1), 93.30 (R2), 98.50 (R3).
Author

Peter Iosif, ACA, MBA
IronFX
Mr. Iosif joined IronFX in 2017 as part of the sales force. His high level of competence and expertise enabled him to climb up the company ladder quickly and move to the IronFX Strategy team as a Research Analyst. Mr.