Gold-Silver ratio widening again indicating bullish setup for Silver
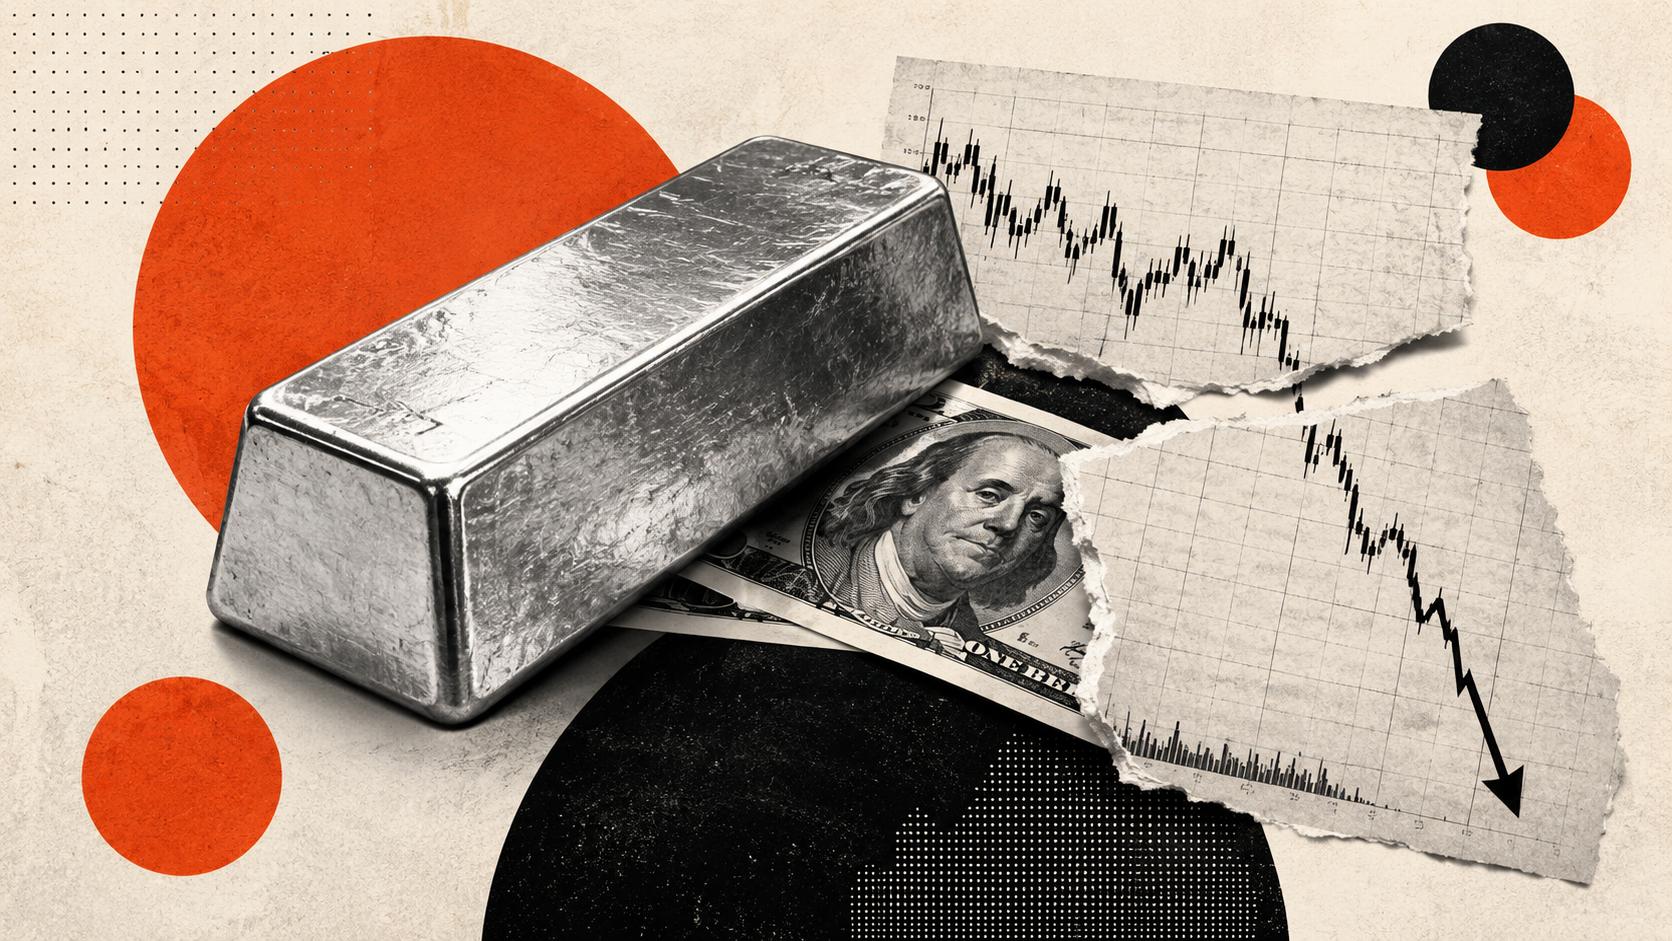
Silver is becoming increasingly discounted relative to gold, as indicated by the widening of the gold-silver ratio.
In other words, silver is on sale once again.
Both silver and gold are down sharply since their record peaks in January. However, silver’s downward trajectory was even steeper than gold’s. While the yellow metal has dipped around 30 percent from its record, silver has plunged by more than 50 percent.
This widening spread between the two metals is reflected in the gold-silver ratio, which appears to indicate another bullish setup for silver.
What is the Gold-Silver ratio?
The gold-silver ratio tells you how many ounces of silver it takes to buy one ounce of gold given the current spot price of both metals. In other words, it tells you the price of gold in ounces of silver.
The price relationship between these two metals can help technical analysts anticipate price moves.
From a historical perspective, when you see gold-silver ratios well above their historical average, it tells you that silver is underpriced compared to gold, and there is a strong possibility that silver will go on a bull run to close that gap.
This has often happened in the midst of a gold bull rally, with silver outperforming gold. (Of course, past performance does not guarantee future results.)
In the modern era, the gold-silver ratio has averaged between 40-1 and 60-1. When the gold-silver ratio gets far above the high end of that historical average, it tends to return to the mean with a vengeance.
For instance, in 2020, the gold-silver ratio set a record of 123-1 as Covid hysteria gripped the world, then plunged to around 60-1 as central banks cranked up the money-creation machine to cope with governments shutting down economies.
In another example of this snap-back, the gold-silver ratio fell to 30-1 in 2011 after rising to over 80-1 during the money creation of the Great Recession in the wake of the 2008 financial crisis.
Gold-Silver ratio flips bullish
The gold-silver ratio recently went through a similar swing. For months before the October silver squeeze that drove the price over $50 for the first time, the gold-silver ratio was running between 80-1 and 80-1. In fact, it rose to over 100-1 in March 2025. At the time, I wrote that the wide ratio signaled significant upside for silver, and forecast that the price would ultimately rise to close the gap.
Sure enough, as silver spiked in January, the gold-silver ratio plunged to 43-1, at the low end of the historical average.
Now, it appears we are setting up for yet another silver rally.
As of Friday, the gold-silver ratio had crept back up to over 70-1, indicating that silver is once again historically underpriced compared to gold.
That doesn’t mean that another price surge is imminent. As we saw last year, the ratio can stay historically wide for long periods of time before correcting to the mean. However, the widening gold-silver ratio is a bullish indicator for silver, and at some point, it will return to the historical average (if history is any indication).
Along with the fact that the market fundamentals that drove last year’s rally remain in place, investors probably shouldn’t be too quick to write off silver. It appears to be on sale, and that would make this a buying opportunity.
To receive free commentary and analysis on the gold and silver markets, click here to be added to the Money Metals news service.
Author

Mike Maharrey
Money Metals Exchange
Mike Maharrey is a journalist and market analyst for MoneyMetals.com with over a decade of experience in precious metals. He holds a BS in accounting from the University of Kentucky and a BA in journalism from the University of South Florida.