$4,200 Gold isn’t a breakdown – it’s a test. And the buyers are waiting

Gold (XAU/USD) is enduring one of its toughest days in recent weeks. The precious metal falls nearly 4% on Monday and trades around $4,120 at the time of writing, after slipping below $4,200 for the first time since early August.
The break is significant, but $4,200 is unlikely to be the level that determines Gold’s next major trend on its own. The real test may lie further down.
The problem for buyers is that they have little reason to rush. Momentum remains negative, US yields are hovering near multi-year highs, and upcoming US economic data could still significantly reshape Federal Reserve (Fed) expectations.
Why $4,200 may not be the level that really matters
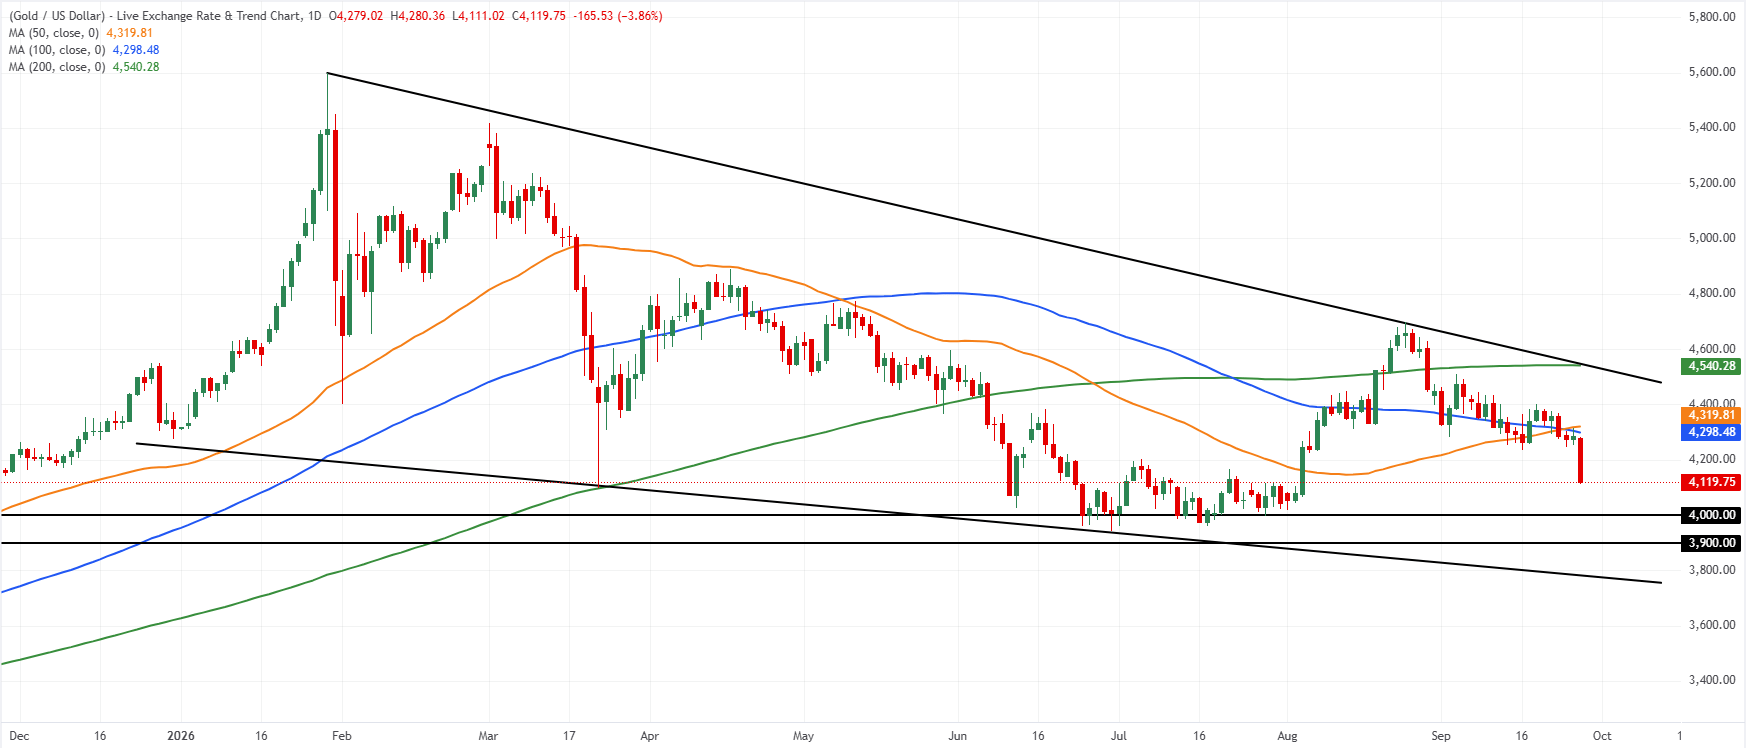
Gold’s move below $4,200 naturally attracts attention because of the level’s psychological importance. It also marks an acceleration of the correction from the August peak near $4,700. However, the daily chart suggests that the area immediately below current prices could be far more important than the level that was breached.
Gold has already established several lows around $4,000 in recent months. The $3,900-$4,000 region notably corresponds with the June and July troughs and a former major reversal area from October and November 2025.
Societe Generale reaches a similar conclusion. The bank’s analysts identify initial support around $4,095 before highlighting the June and July lows at $3,960-$3,940 as a crucial area for the precious metal.
This changes the interpretation of the move below $4,200. Sellers have taken control of short-term momentum, but they have not necessarily won the battle over the broader structure.
A continuation toward $4,000 would therefore not automatically amount to capitulation. Instead, it would bring Gold toward a much more significant test of underlying demand.
Buyers may wait for $4,000, but sellers still have strong arguments
That distinction should not obscure the extent of the current deterioration. Gold remains trapped in a broad bearish structure since reaching its all-time high near $5,600 in January. Successive peaks have been getting lower, while the August recovery attempt stalled around $4,700, directly below the descending upper boundary visible on the daily chart.
The precious metal also trades below its 50-day, 100-day and 200-day moving averages, while recently failing to establish itself above the 200-day moving average. In other words, the idea that buyers could return around $4,000-$3,900 does not mean that this area necessarily has to hold.
A sustained break below $3,900 would shift attention toward the lower boundary of the descending wedge, which could provide a final important support area near $3,800. This broadens the real decision zone to approximately $4,000-$3,800.
Below that area, the argument that the decline represents only a test would become considerably more difficult to defend.
Why is Gold falling when geopolitical risk remains elevated?
Gold’s current weakness is particularly striking because the geopolitical backdrop should, in theory, favor a safe-haven asset. The Middle East war and disruptions around the Strait of Hormuz continue to fuel concerns over energy supplies. US President Donald Trump rejected Iran’s latest proposal to reopen the strait over the weekend, although further indirect negotiations are expected.
For Gold, however, the most important consequence of the conflict currently lies elsewhere: in Oil prices and, by extension, inflation and interest-rate expectations.
Higher energy prices reinforce the risk that inflation remains elevated. Investors are consequently pricing in further tightening from the Fed, following its 25-basis-point rate increase in September.
This repricing is pushing US bond yields higher. The benchmark 10-year US Treasury yield advanced to around 5.26%, its highest level since 2007. For a non-yielding asset such as Gold, this sharply increases the opportunity cost of holding the metal. The US Dollar (USD) is also hovering near recent highs, creating a second source of pressure.
Gold is therefore in an unusual position. The same geopolitical shock that should theoretically increase safe-haven demand is pushing Oil prices higher, fueling inflation expectations, lifting bond yields and ultimately strengthening the monetary headwinds facing the precious metal.
The Fed could decide whether buyers step in now or lower
This is where a decline toward $4,000 could become particularly interesting. The coming days feature several US economic releases capable of quickly changing the trajectory of Treasury yields and the US Dollar.
Investors will notably monitor Personal Consumption Expenditures (PCE) inflation data, the Institute for Supply Management (ISM) surveys and, above all, the Nonfarm Payrolls (NFP) report, all scheduled for this week. These releases will help determine whether the current combination of persistent inflation and economic resilience actually warrants further rate hikes.
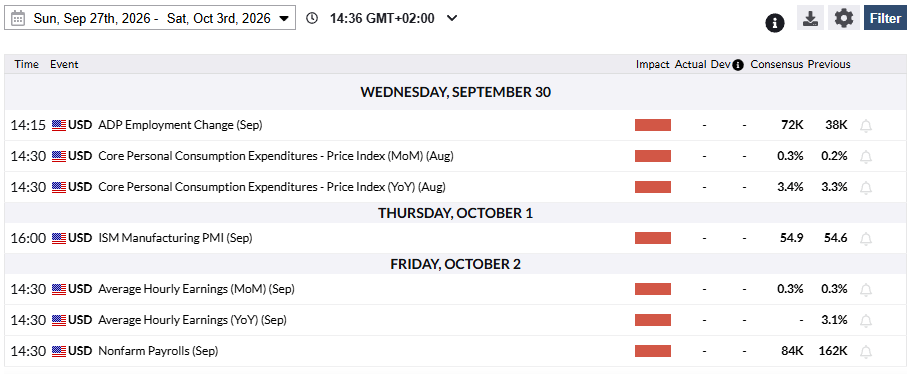
Strong figures, particularly if accompanied by hotter-than-expected inflation, could reinforce monetary-tightening expectations. In this scenario, US yields could remain elevated and Gold would have little fundamental reason to rebound immediately. The $4,000-$3,900 area, and potentially the lower boundary near $3,800, would then become vulnerable.
The opposite scenario is equally important. Signs of economic weakness or softer-than-expected inflation could reduce expectations of further rate hikes, pull yields lower and weigh on the US Dollar. If such a shift occurs while Gold simultaneously tests historical support around $4,000-$3,900, conditions would become significantly more favorable for buyers to re-emerge.
The technical level and the macroeconomic catalyst could therefore converge at the same time.
Long liquidation is the main risk before $4,000
There is another reason why the market could temporarily overshoot the levels where buyers are theoretically expected to emerge: positioning.
According to CFTC Commitments of Traders (COT) data from September 22, speculators accumulated a record amount of Gold futures in nominal terms over a three-week period as prices started to retreat. With many of these positions established above current prices, further weakness could trigger additional long liquidation and amplify downside pressure.
The move can then become self-reinforcing. Falling prices trigger exits from long positions, those sales accelerate the decline, and the resulting weakness forces additional investors to reduce their exposure.
Signs of deleveraging are already emerging in China. According to Goldman Sachs’ Gold trading desk, long positions were liquidated at the Shanghai Futures Exchange (SHFE) open, with open interest falling by around 11,000 contracts, or 2.6%. With the exchange set to close from October 1 to October 7 for the National Day holiday, further pre-holiday position reductions could add to short-term selling pressure.
A potential acceleration below $4,000 would therefore not necessarily mean that structural demand for Gold has disappeared. It could also reflect a period of deleveraging and liquidation before investors with longer time horizons return to the market.
Behind the correction, central bank demand has not disappeared
This is precisely what separates the current correction from an already confirmed structural reversal. High real yields represent a powerful short-term obstacle, but central bank demand, one of the fundamental drivers behind Gold’s longer-term advance, remains in place.
Reported official-sector purchases reached 23 tonnes in July, according to the World Gold Council. Some estimates suggest that actual demand could be substantially higher than officially disclosed figures.
Goldman Sachs estimates that central bank purchases may have reached around 44 tonnes in July. The bank therefore considers sovereign accumulation an ongoing source of structural support for the market and maintains a $4,900 Gold forecast for the end of the year.
This demand does not, however, guarantee a $4,000 floor. Central banks do not need to prevent every market correction, and speculative flows can dominate price action for several weeks or months.
However, it explains why the current area cannot be analyzed solely through the lens of short-term bearish momentum.
$4,000-$3,800 could become Gold’s real decision zone
The chart ultimately reveals two realities that are not mutually exclusive. The first is clearly bearish. Gold has lost more than 25% from its January peak near $5,600, remains below several important moving averages and continues to register lower highs. As long as the upper boundary of the wedge is not reclaimed, sellers retain the advantage over the medium-term horizon.
Second, the correction is now approaching an area where the balance between risk and potential begins to change. The $4,000-$3,900 region combines a major psychological threshold, several previous lows and an area that has already triggered buying reactions. The lower boundary of the wedge then extends this potential demand zone toward approximately $3,800.
Gold’s next major move may therefore not be decided by the break below $4,200, but by how the market reacts as it approaches this pocket of support. If US yields continue to rise, the US Dollar remains firm and US economic data reinforce expectations of further rate hikes, sellers still have room to test the lower part of this zone.
But if economic data begin to challenge the monetary-policy scenario currently priced into markets just as Gold returns toward $4,000-$3,900, buyers with little reason to chase the market at $4,200 could find exactly what they are waiting for: a lower price and, more importantly, a catalyst to return.
The fall below $4,200 is therefore a warning. On its own, it is not yet evidence of a structural reversal. The real verdict could come a few hundred dollars lower.
Gold FAQs
Gold has played a key role in human’s history as it has been widely used as a store of value and medium of exchange. Currently, apart from its shine and usage for jewelry, the precious metal is widely seen as a safe-haven asset, meaning that it is considered a good investment during turbulent times. Gold is also widely seen as a hedge against inflation and against depreciating currencies as it doesn’t rely on any specific issuer or government.
Central banks are the biggest Gold holders. In their aim to support their currencies in turbulent times, central banks tend to diversify their reserves and buy Gold to improve the perceived strength of the economy and the currency. High Gold reserves can be a source of trust for a country’s solvency. Central banks added 1,136 tonnes of Gold worth around $70 billion to their reserves in 2022, according to data from the World Gold Council. This is the highest yearly purchase since records began. Central banks from emerging economies such as China, India and Turkey are quickly increasing their Gold reserves.
Gold has an inverse correlation with the US Dollar and US Treasuries, which are both major reserve and safe-haven assets. When the Dollar depreciates, Gold tends to rise, enabling investors and central banks to diversify their assets in turbulent times. Gold is also inversely correlated with risk assets. A rally in the stock market tends to weaken Gold price, while sell-offs in riskier markets tend to favor the precious metal.
The price can move due to a wide range of factors. Geopolitical instability or fears of a deep recession can quickly make Gold price escalate due to its safe-haven status. As a yield-less asset, Gold tends to rise with lower interest rates, while higher cost of money usually weighs down on the yellow metal. Still, most moves depend on how the US Dollar (USD) behaves as the asset is priced in dollars (XAU/USD). A strong Dollar tends to keep the price of Gold controlled, whereas a weaker Dollar is likely to push Gold prices up.
Author

Ghiles Guezout
FXStreet
Ghiles Guezout is a Market Analyst with a strong background in stock market investments, trading, and cryptocurrencies. He combines fundamental and technical analysis skills to identify market opportunities.
















