233 years of Gold history

S2N spotlight
Gold is currently shining bright. How did we get to $3000 an ounce? I need to take you back a few hundred years in order to understand.
Once upon a time, a great man Thomas Jefferson proposed the dollar (as a decimal-based unit of currency) in 1784 and helped persuade the Continental Congress to adopt the U.S. dollar officially in 1785. In short:
- 1784: Jefferson wrote his influential pamphlet, Notes on the Establishment of a Money Unit, and of a Coinage for the United States, where he recommended using the “dollar” as the fundamental unit in a decimal system.
- 1785: The Continental Congress formally adopted “dollar” as the name of the U.S. currency unit.
- The Coinage Act of 1792 established the U.S. Mint and set out the coins’ denominations.
Don’t ask me how I was able to get the data for the chart below. It took more scraping than a plastic surgeon on Pinocchoi’s nose. Stay with me; things are about to get exciting.
-638775249505639425.png)
Look at the gold price through the entire 1800's; it barely moved. This is exactly how it was designed to behave by Jefferson. It grew annually at 0.05% as money was pegged to a gold standard. By 1933, in the depths of the Great Depression, the peg was maintained, but US citizens could no longer demand physical gold for their dollars.
In 1944, the Bretton Woods Agreement came into being, where gold was fixed at $35 an ounce and all the countries that signed the agreement pegged their currencies to the dollar. In 1971, that all ended with President Nixon leaving the gold standard.
By now most of you know that I am in favour of stable money. Take a look at the stability of the 1800’s. What most crypto enthusiasts don’t get is that stable money is not meant to be speculative. I do understand that while fiat is the dominant means of “storing” wealth, then gold and bitcoin will continue to be the beneficiaries of the wealth destruction that excessive money creation brings.
Today is not the day to debate the pro’s and con’s of a gold standard. I am just delighted I could put this chart together to demonstrate how the removing of the dollar from the gold standard towards a fiat currency has seen the average annual growth of gold go to 8% per annum since 1971 from less than 0.5% before that. In case you were wondering, inflation has averaged 4% since 1971.
S2N observations
I have mentioned before that Elon Musk and his bro Donald Trump are not shy of exaggerating at the expense of the truth. You have to laugh at the name of Trumps twitter service, Truth Social. This week saw the launch of the Doge Tracker.
-638775249841825239.png)
According to the site and many of the experts in this area, they say Musk is overstating the saving of DOGE by 92%. There is a huge amount of ego and stakes riding on the savings DOGE is able to achieve.
One of his classics is that he looks at the potential increases a current contract could experience, not what the actual current contract is expensing, and then he takes the higher potential amount as the point to calculate the savings from. I couldn’t do this job I am a fan of Trump and Musk, but it doesn’t stop me from calling out BS when I see it.
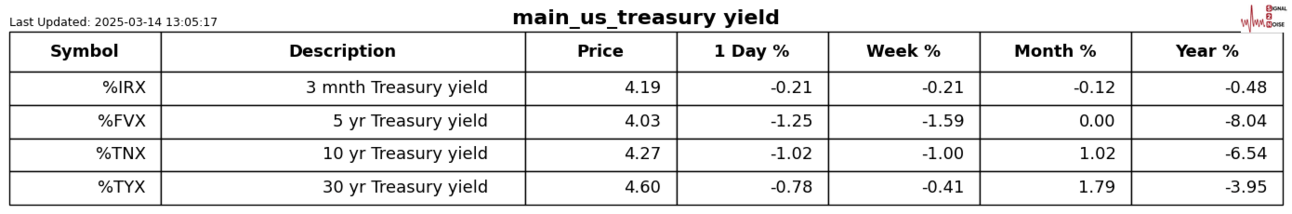
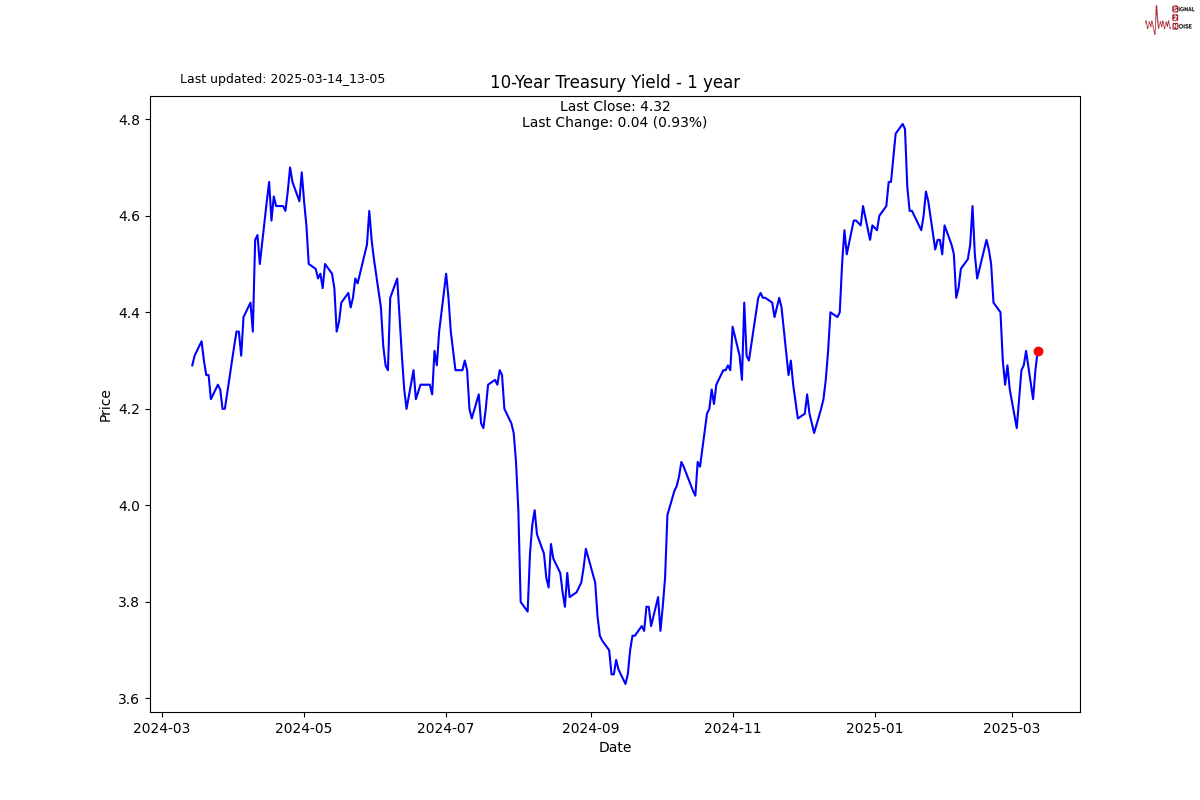
The government needs to do everything to protect the long end of the bond market breaking lower. It is my view that new lows are coming. If the red dotted trend line breaks, then the October lows of 2023 are in play, and from there, who knows how bad it could get?
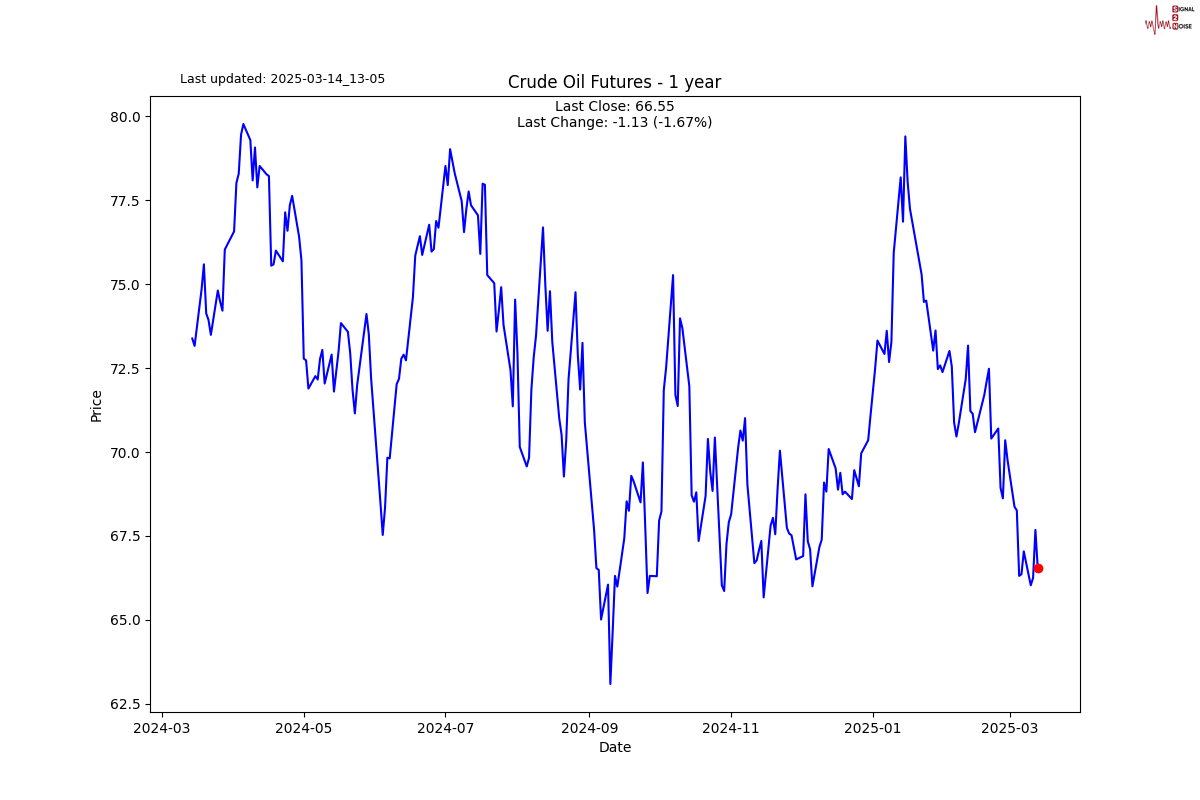
-638775250048758072.jpg)
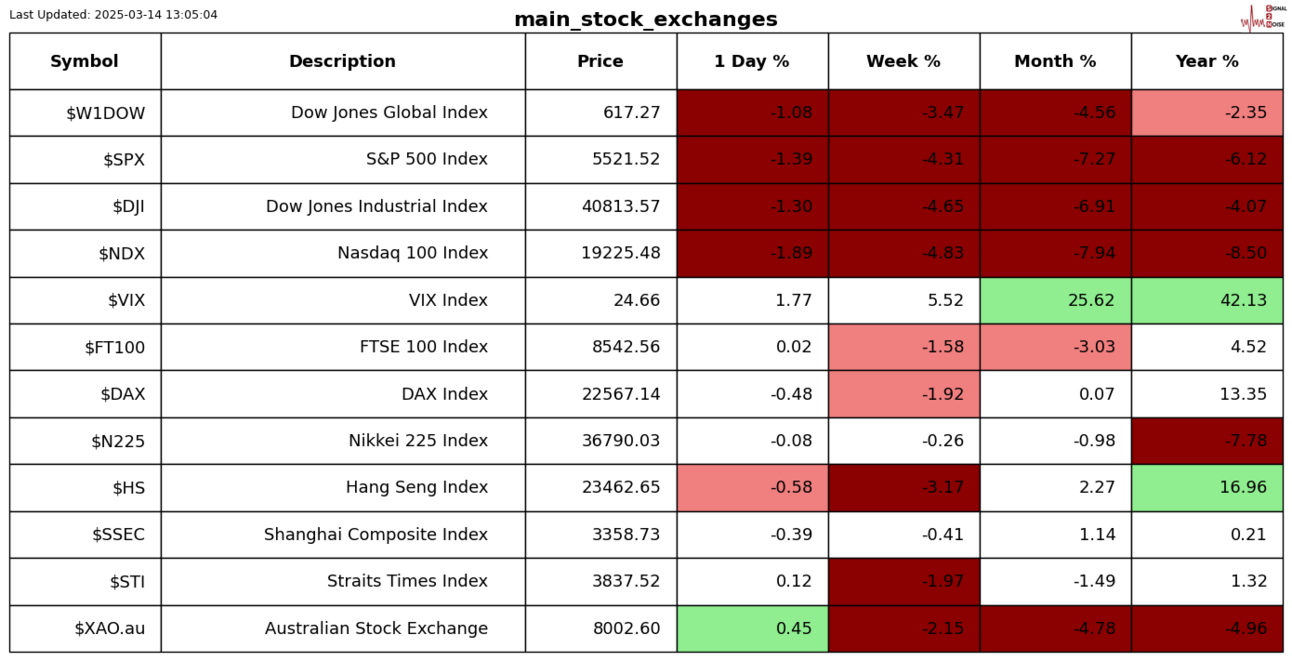
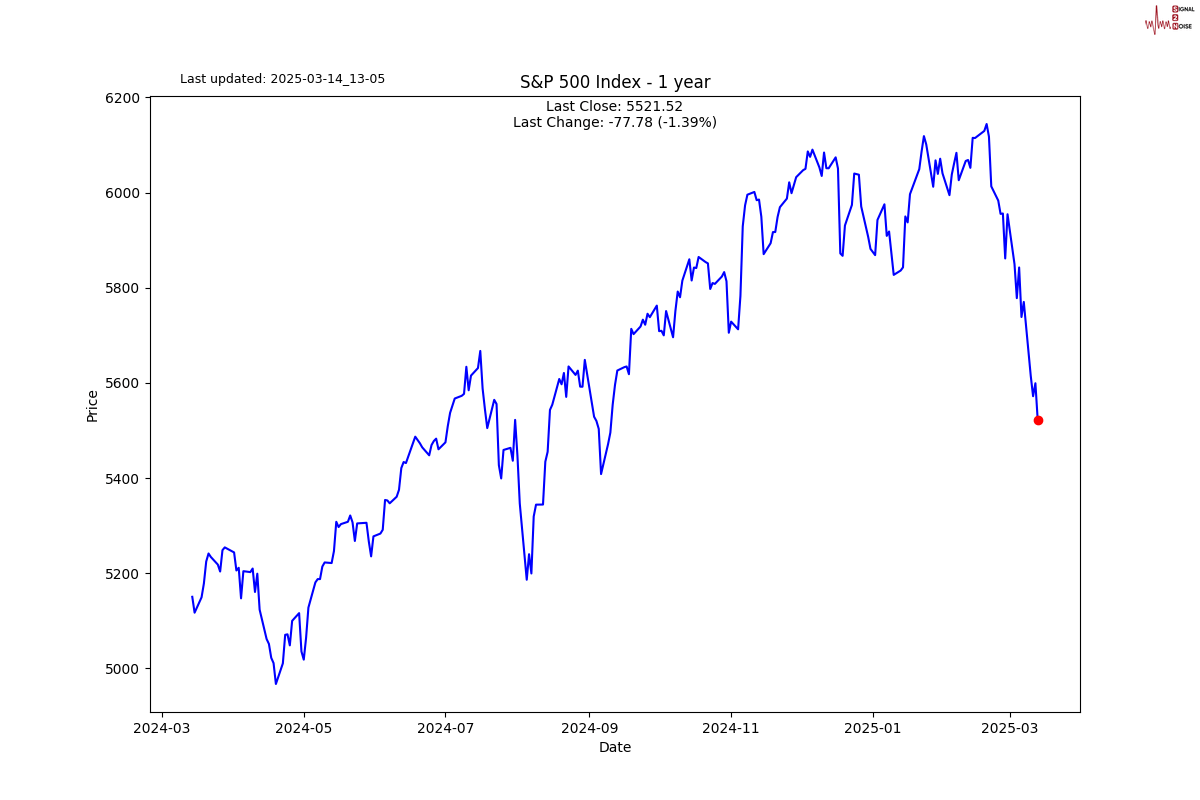
The S&P 500 is officially in correction mode with a 10% drawdown. As you can see, there is nothing unusual with the chart. This is run of the mill normal. I have been bearish since last year, so I clearly don’t think this is run of the mill, but for now there is no evidence. I am seeing an extremely overvalued market, that is now staring a trade war and tarrif inflation in the face. I remain very sceptical on tarrifs.
-638775250236647671.png)
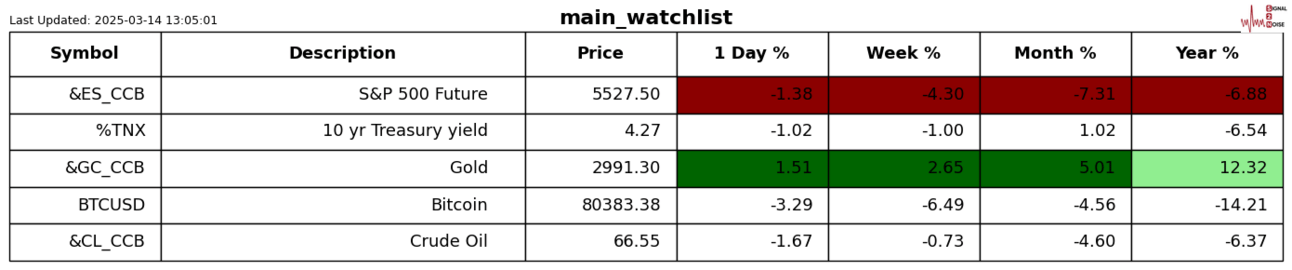
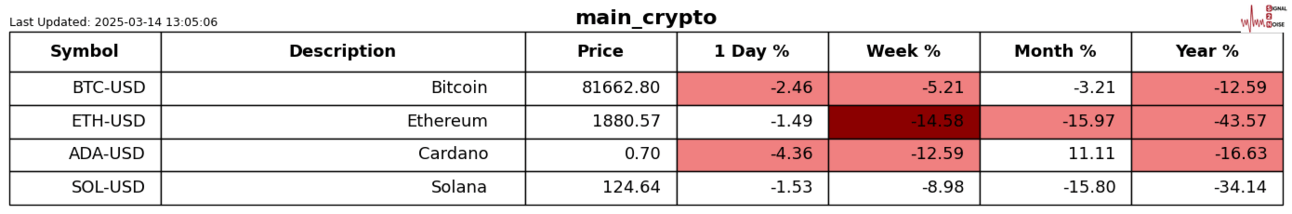
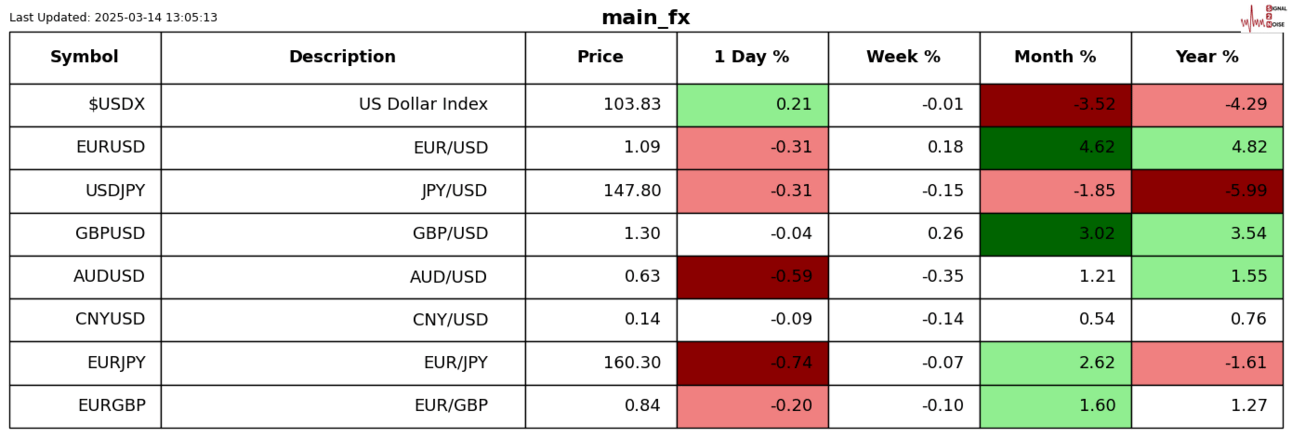
S2N screener alert
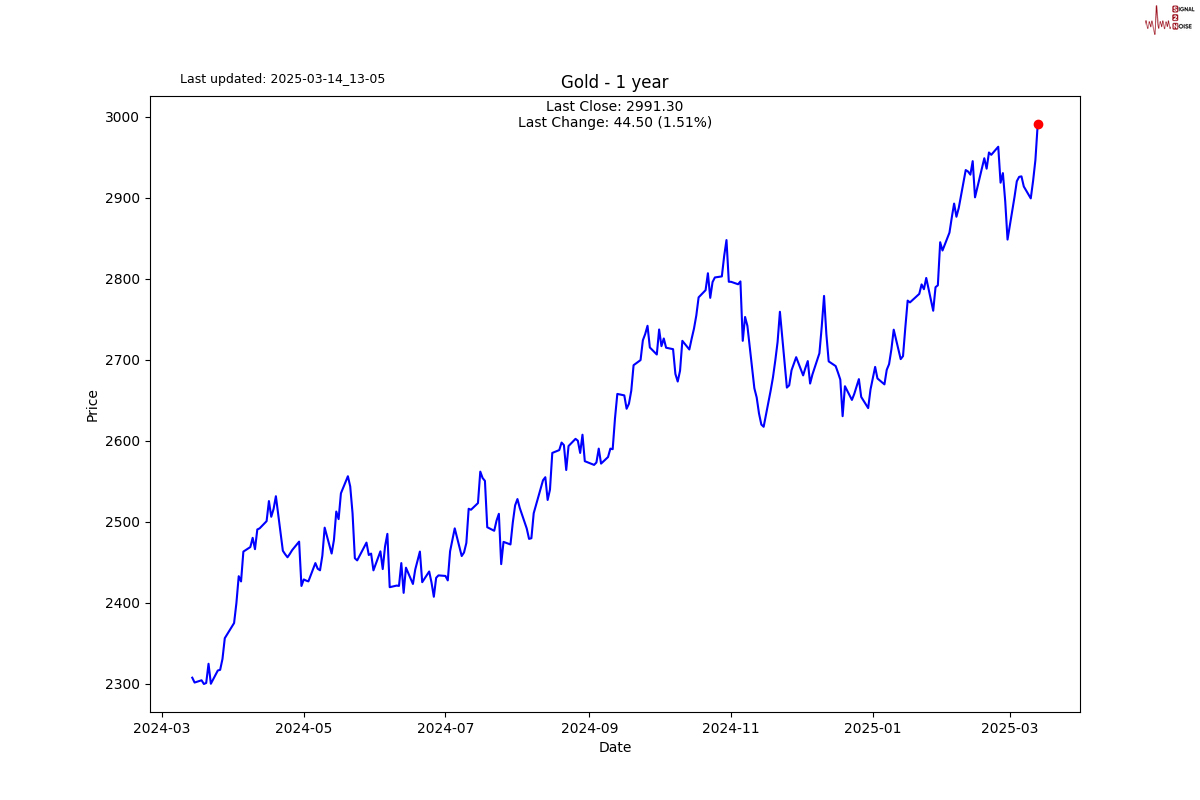
Big up day for gold nearly 3000, the April delivery future did crest 3000.
-638775250584607351.png)
S2N performance review

S2N chart gallery

S2N news today
-638775253737094393.png)
Author

Michael Berman, PhD
Signal2Noise (S2N) News
Michael has decades of experience as a professional trader, hedge fund manager and incubator of emerging traders.


