2008 and 2022 all over again? Gold, stocks, USDX

Can the HUGE price move from those years really be repeated?
Analogous situations: 2008, 2022, and now
As gold continues to move back and forth in the same trading range, I decided to dedicate today’s analysis to something different. After all, I already described my current gold price forecast for May 2024 and the situation in the forex market remains just as I had described it earlier.
I emphasized many times that the current situation is analogous to 2008 and 2022 due to several reasons, and one of them is the similarity in world stocks. They reach the same price levels.
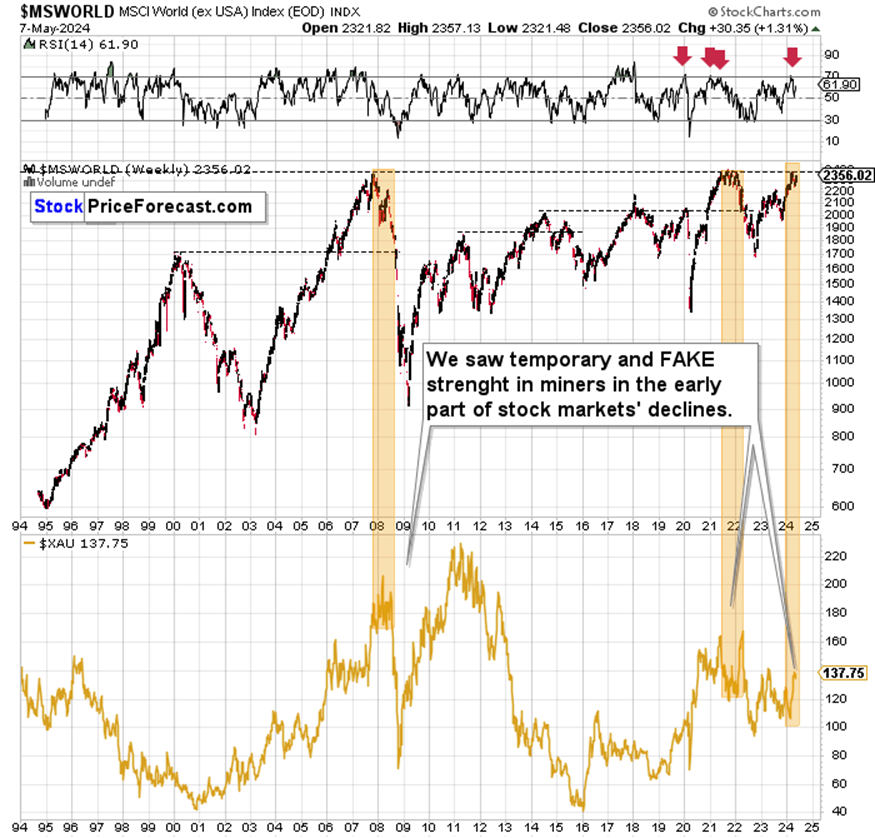
In all three marked cases – 2008, 2022, and now – we see similar performance in mining stocks. The latter moved higher in a way that was quite notable on a short-term basis, but not when compared to the previous medium-term price moves.
I described that the overall implications are bearish as ultimately in both: 2008 and 2022 miners declined significantly, but what I would like to do today is to examine those previous years in greater detail and consider what was happening also in other markets at that time.

Starting with 2008, we see that stocks were actually first to top, then gold topped along with the USD Index’s bottom – and that was when miners also formed their final high.
The important detail, however, is that initially (between Nov. 2007 and Mar. 2008), miners (XAU Index at the bottom of the chart) were weak relative to gold, and then they faked strength right before the decline. In late June and early July, miners moved quite close to their previous high, while gold didn’t, especially in late June. The decline in gold and miners picked up pace when the USD Index rallied decisively and when stocks declined in a profound way. The latter was particularly important for the miners.
Let’s check how it looked in 2022.
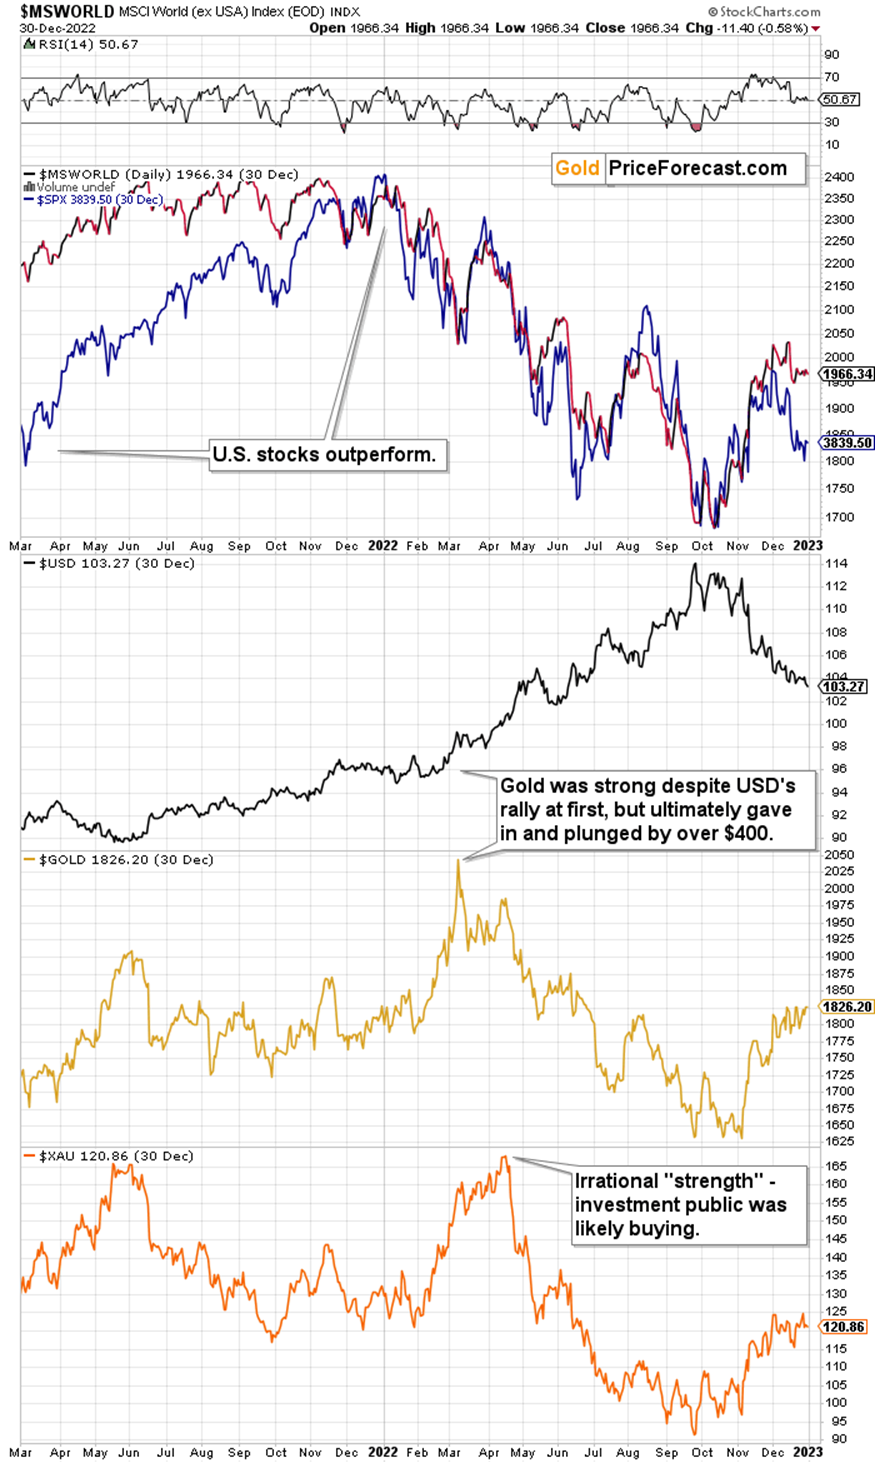
Once again stocks were first to top, then gold and miners topped. The interesting thing this time, was that the USD Index’s bottom and gold’s top were not aligned. The dollar bottomed first, and gold ignored its rally initially, but only initially. When the USD Index showed that it wasn’t fooling around and that it meant business, gold plunged.
The U.S. stocks (S&P 500 Index) moved higher in a more visible manner.
Once again, the really interesting thing was that after being weak initially (in early March 2022 miners didn’t move to new high while gold did), miners faked strength right before the big decline. Namely, in early April 2022, miners moved to new short-term highs, while gold didn’t.
The April – June decline was particularly big in case of miners as both: gold and stocks were declining.
Implications and future forecast
What does the above tell us? Several things:
-
The huge declines in stocks are likely to translate into huge declines in miners, but before the most volatile part of the decline happens, the timing doesn’t have to be aligned in the short run.
-
Gold price is likely to be linked to the USD Index, but it might initially rally despite USD’s gains, and it’s likely to slide once the USD Index proves that it can continue to rally for longer.
-
The final days/weeks before the really big decline are likely to be characterized by mining stocks’ fake strength.
-
The U.S. stocks might be rallying in the final parts of the rally while world stocks no longer move to new highs.
All right, let’s see how the above checks out in the current market environment.
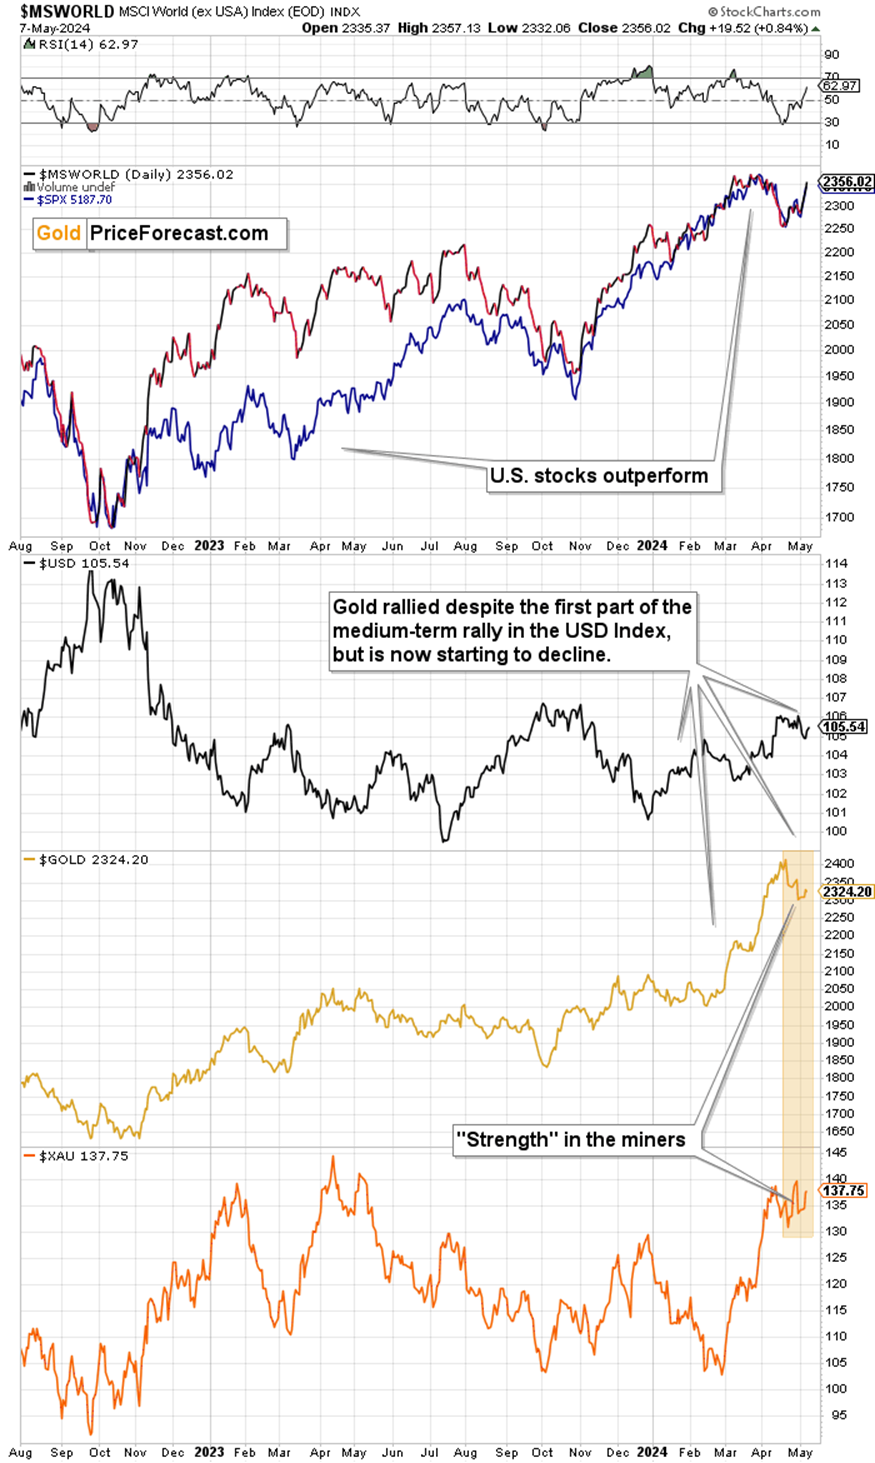
Starting with point 4, we see a reaction that’s more or less in the middle of what we saw in 2008 and 2022. The U.S. stocks are rallying more than world stocks, and their outperformance is visible, particularly since the beginning of 2023, but it’s not the case that the world stocks stopped at their short-term highs. They stopped at their long-term highs, though, suggesting that the situation is indeed rather similar.
Point 3 definitely checks out – I marked the recent “strength” of miners with the orange rectangle, and it’s clear that miners had underperformed previously as they didn’t even move to their 2023 high, while gold moved way above it.
Point 2 appears to be aligned as well. Gold price initially rallied despite USD’s rally and now it’s declining.
Point 1 is something that’s still likely to play out in the future – it’s not the time to assess it. We’ll know only once both declines happen, which means that it will be too late to react. This will be the time that the ones that had prepared will be wondering what to do with their huge profits.
All in all, the things that might seem game-changers (why are miners holding up so well?) or out of tune (are gold and dollar de-coupling here?), are actually yet another rhyme of history that becomes clear when one examines the situations that are indeed analogous. The upcoming price moves are likely to bring superb returns to those who are prepared, and being aware of the long-term cycles and analogies helps in that process.
Want free follow-ups to the above article and details not available to 99%+ investors? Sign up to our free newsletter today!
Want free follow-ups to the above article and details not available to 99%+ investors? Sign up to our free newsletter today!
Author

Przemyslaw Radomski, CFA
Sunshine Profits
Przemyslaw Radomski, CFA (PR) is a precious metals investor and analyst who takes advantage of the emotionality on the markets, and invites you to do the same. His company, Sunshine Profits, publishes analytical software that any


