148 gigawatts announced, 12 running: AI financing outran the grid
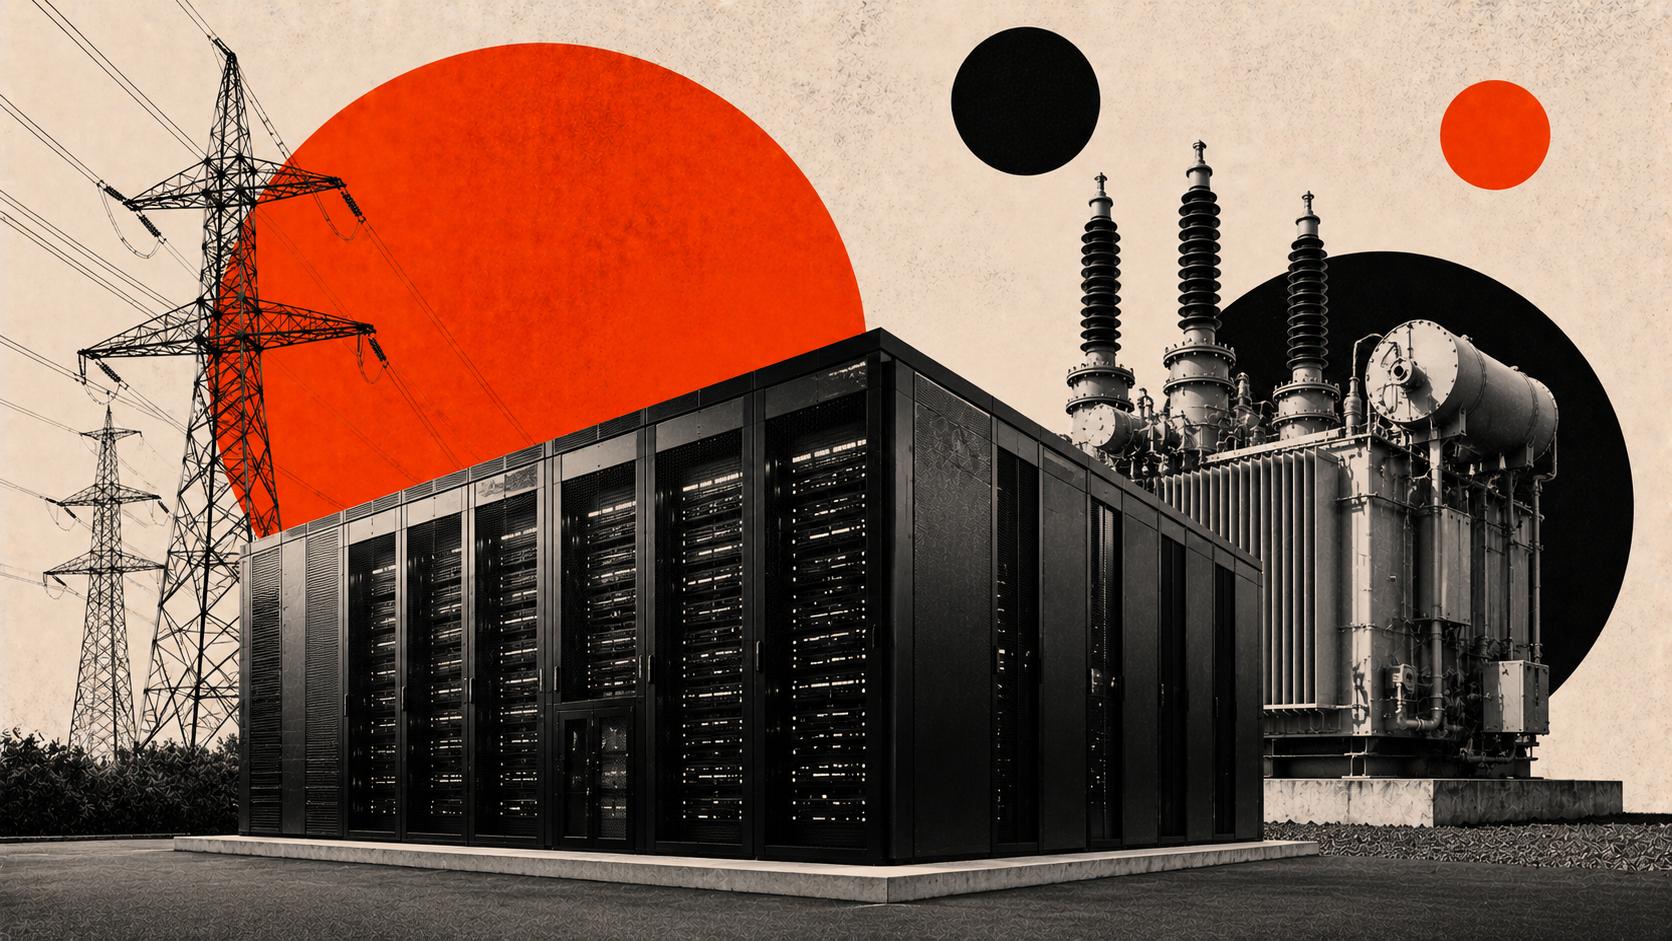
Since the start of 2024, the hyperscale data centre industry has announced 148 gigawatts of capacity. It has 12.3 gigawatts operational. Less of a forecasting error and more of a financing decision, announced capacity is being underwritten, drawn against and levered as though it were deliverable capacity, and the distance between the two is measured in transformer lead times rather than in demand.
A further 20.6 gigawatts sits in construction, so roughly a fifth of everything announced across two and a half years has steel in the ground. The rest is a press release attached to a land parcel. Eight percent of announced capacity is running. That ratio is the most important number in the artificial intelligence (AI) financing debate, and functionally nobody is positioning on it.
This is an AI load, not a cloud load
Data centres have always been built, and pipelines have always slipped. What is new is the composition. Gartner puts AI-optimised servers at 31% of global data centre power consumption in 2026, and has them overtaking conventional servers in 2027, inside a market moving from 104 gigawatts of demand to 132 in a single calendar year. This is not the cloud growing, it is one workload displacing the rest of the building.
Behind that load sits capital expenditure compounding near 70% a year against operating cash flow near 23%. The four largest buyers took on roughly $434 billion in property, plant and equipment in the four quarters through March against roughly $149 billion of reported depreciation. Alphabet's (GOOG, GOOGL) free cash flow went negative in the second quarter for the first time since it first went public, Amazon's (AMZN) trailing twelve-month figure swung negative, and Meta (META) stopped repurchasing shares. Only Microsoft (MSFT) still generates more cash than it spends.
None of that is a demand problem, and none of it is seriously disputed. The question is what the money buys, and on the evidence it is buying announcements considerably faster than it is buying energised capacity.
The gate is a transformer, not a chip
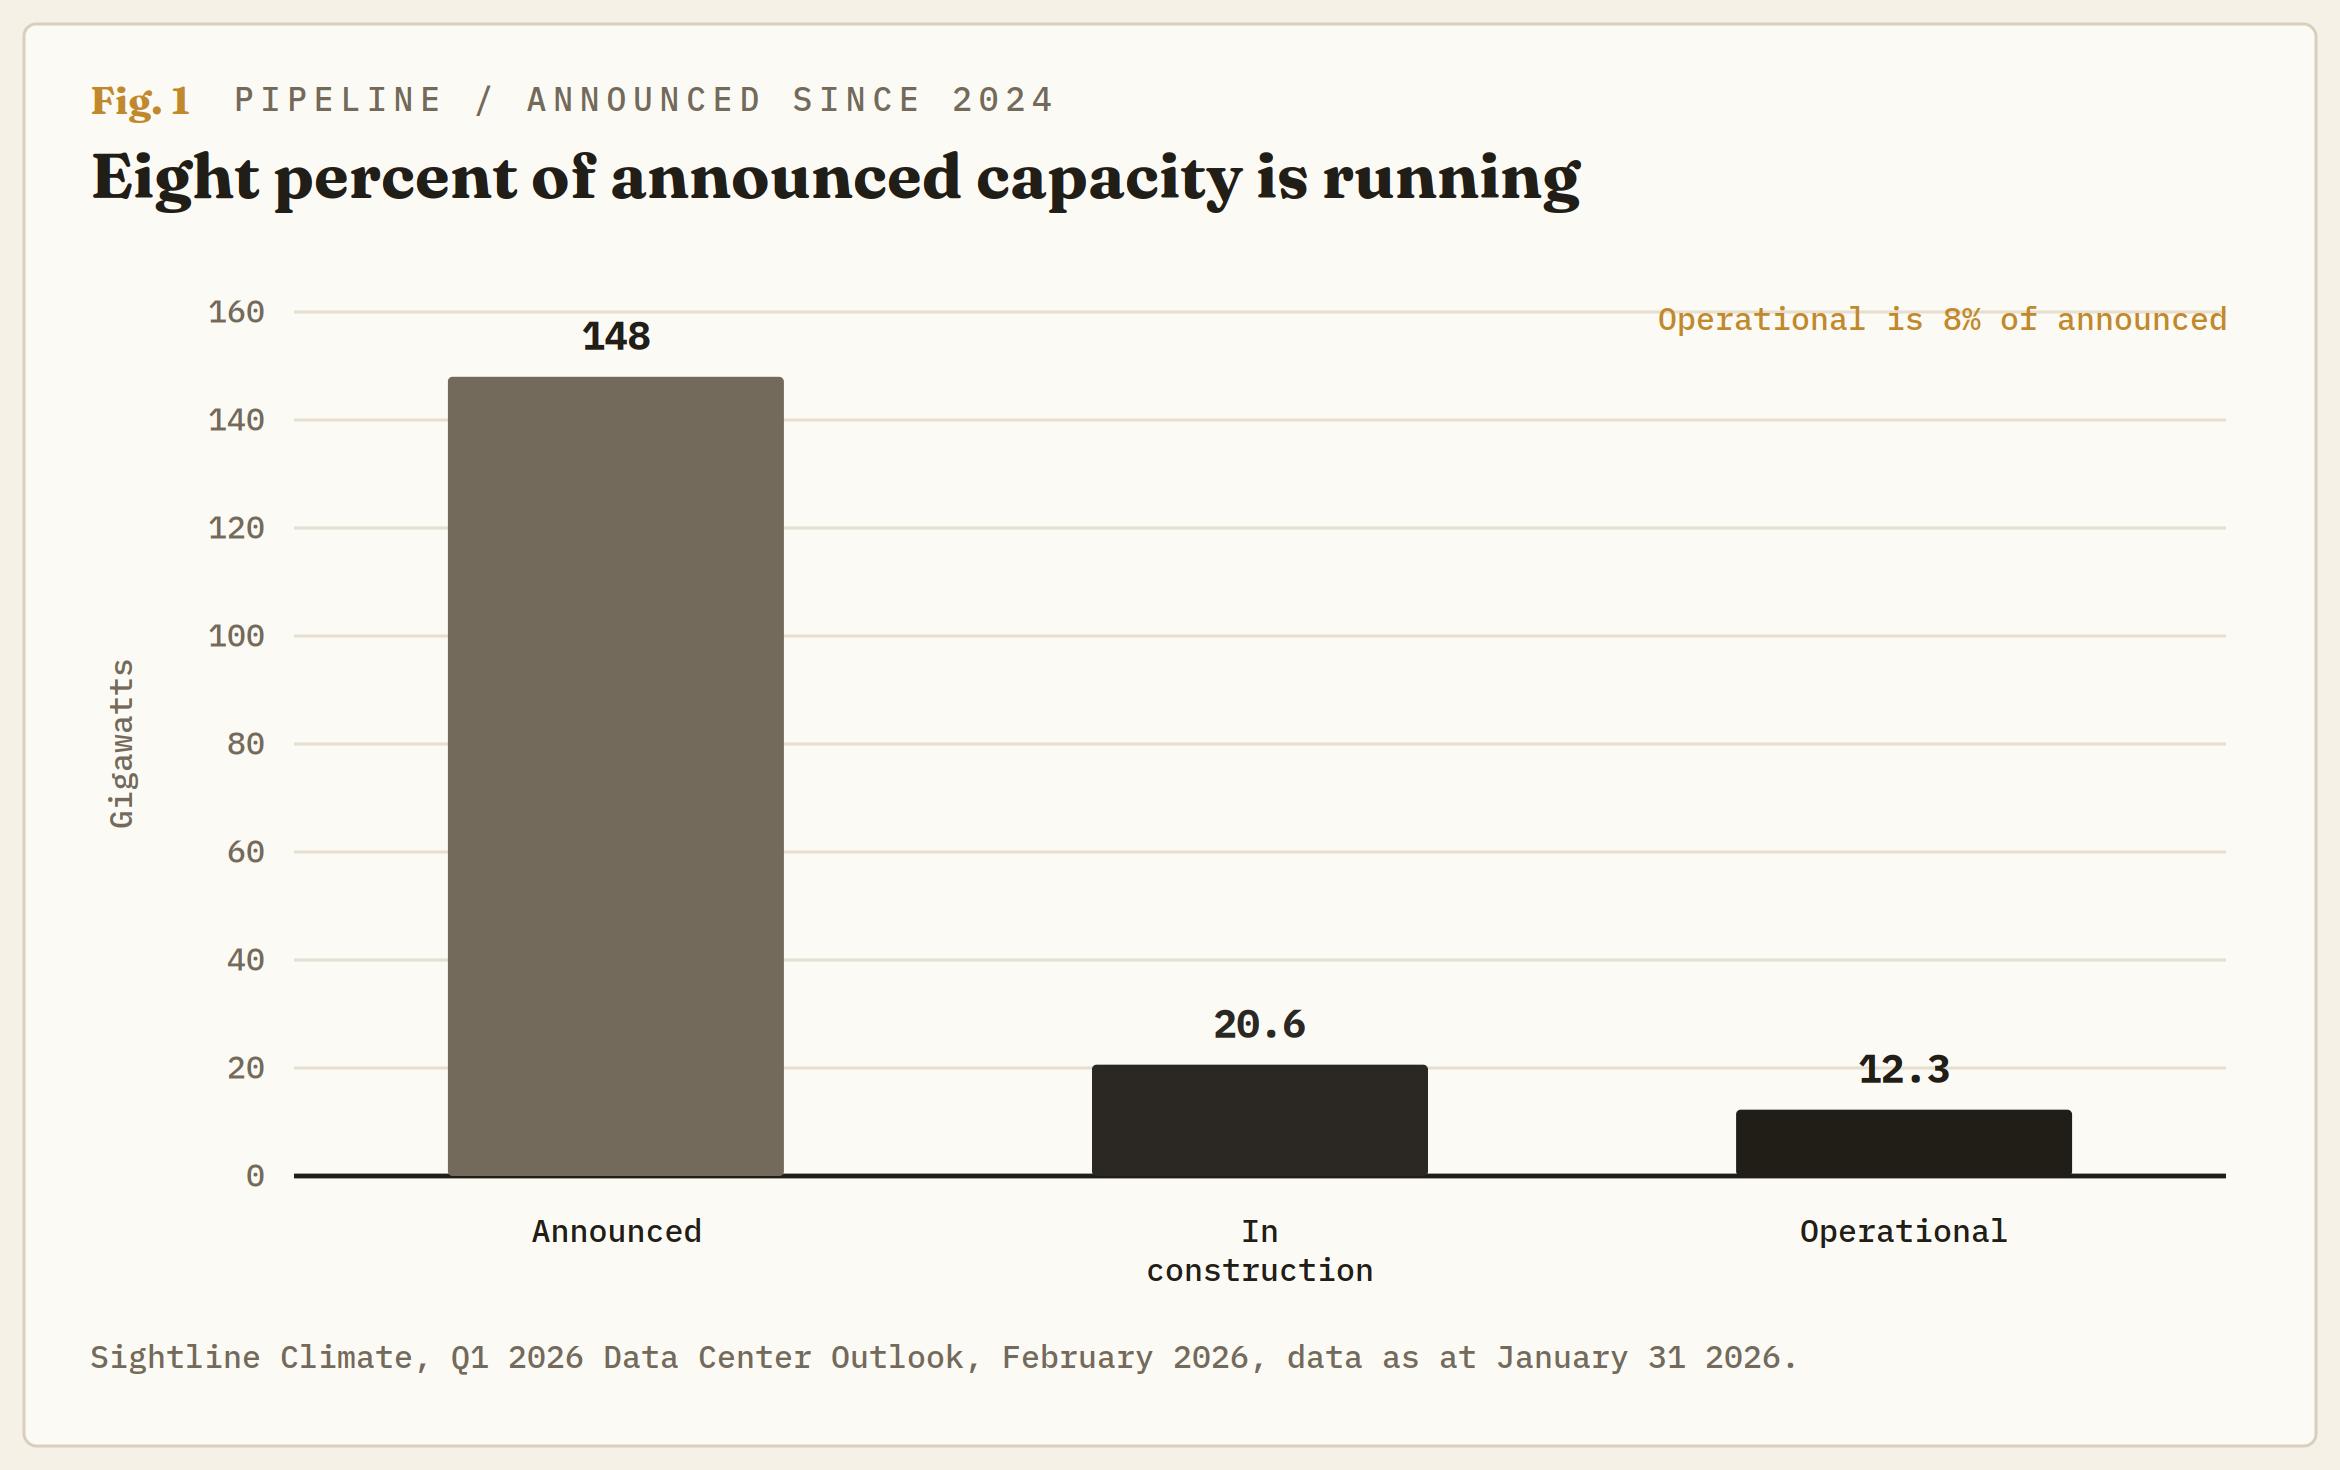
The bottleneck on AI spend has moved, and the market has not repriced for where it went. Large power transformers carry lead times averaging 128 weeks, and generator step-up units run 144, according to Wood Mackenzie's numbers. Demand for step-up units is up 274% since 2019 and substation transformers 116%, with prices 70-150% higher than 2020. The United States imports more than 80% of its large power transformers straight into Section 232 duties that land directly on cores, switchgear housings and frames.
That produces an absurdity nobody underwrites properly. A two billion dollar campus waits on a forty million dollar transformer order, and the schedule is dominated by the smaller number. Chips are not the constraint. Capital is emphatically not the constraint. The constraint is a piece of grid equipment with a two-and-a-half-year queue and a wildly fluctuating tariff on its steel.
The grid queue behind it is worse and better documented. Berkeley Lab counts roughly 8,200 projects seeking interconnection, totaling more than 2,000 gigawatts of generation and storage between them. For projects that actually reached operation in 2025, the median wait from request to operation ran beyond five years. Of everything filed between 2000 and 2020, 13% had reached operation by the end of 2025, and 75% had withdrawn.
Interest starts long before revenue does
Here is where a schedule becomes a credit event. Senior construction facilities in this sector run at loan-to-cost around 60-70%, interest-only against a draw schedule, with the term loan activating only on certificate of occupancy. The developer therefore pays for capital from groundbreaking, takes revenue from energisation, and holds the most expensive tranche in the stack across every week between them.
Stretch that interval and nothing about the debt improves. Cost inflation arrives, equipment availability shifts, interest expense accumulates, and the takeout that was supposed to refinance the build still hasn’t fired. S&P Global's reading of the mechanism is that a delayed facility hits all four at once and ends up weaker than its original financing plan assumed. Lenders have already made interconnection queue position and power delivery schedule the single most examined item in 2026 underwriting.
The tier carrying that interval is not the tier being discussed. CoreWeave (CRWV), the only merchant compute provider of scale that files, carried $35.6 billion of total debt through June 30 against $640 million of net interest expense in the quarter, more than double a year earlier, while guiding $35-$39 billion of capital expenditure for the year. Lambda, Crusoe, Applied Digital and the project vehicles that keep campuses off hyperscaler balance sheets file nothing, so sector leverage is visible only where it happens to be listed.
And the revenue underwriting that debt has one destination. Take-or-pay compute contracts terminate at model developers, not investment-grade tenants. OpenAI alone carries roughly $600 billion of contracted compute across sixty months against barely $130 billion of available liquidity, burning $27 billion in 2026 so far and projecting no positive cash flow before 2030. A developer's five-year lease is worth exactly what that counterparty is worth.
Regulation just took away the exit
On June 18, the Federal Energy Regulatory Commission (FERC) issued six show cause orders under section 206 of the Federal Power Act to PJM and the five other regional transmission organisations and independent system operators, preliminarily finding their tariffs unjust and unreasonable on large load integration. It defined a large load as peak demand above 50 megawatts connecting above 69 kilovolts and gave the operators 60 days to file.
The direction of travel is unambiguous, and it is expensive for developers. The Department of Energy framework that started the docket in October 2025 proposed standardised study deposits and assignment of 100% of network upgrade costs to the interconnecting load. PJM's co-location order from December goes further, requiring the interconnection customer to pay the full cost of upgrades and barring it from withdrawing capacity until those upgrades are in place.
Read that as a financier rather than a regulator. Deposits, readiness milestones, full upgrade cost allocation and a prohibition on withdrawal all raise the capital sunk before a single watt touches the grid, and the last of them removes the developer's option to walk. Development optionality is being converted into fixed obligation at exactly the moment the equipment clock is lengthening. That is the mechanism by which a grid queue turns into a default.
The order book voted in May
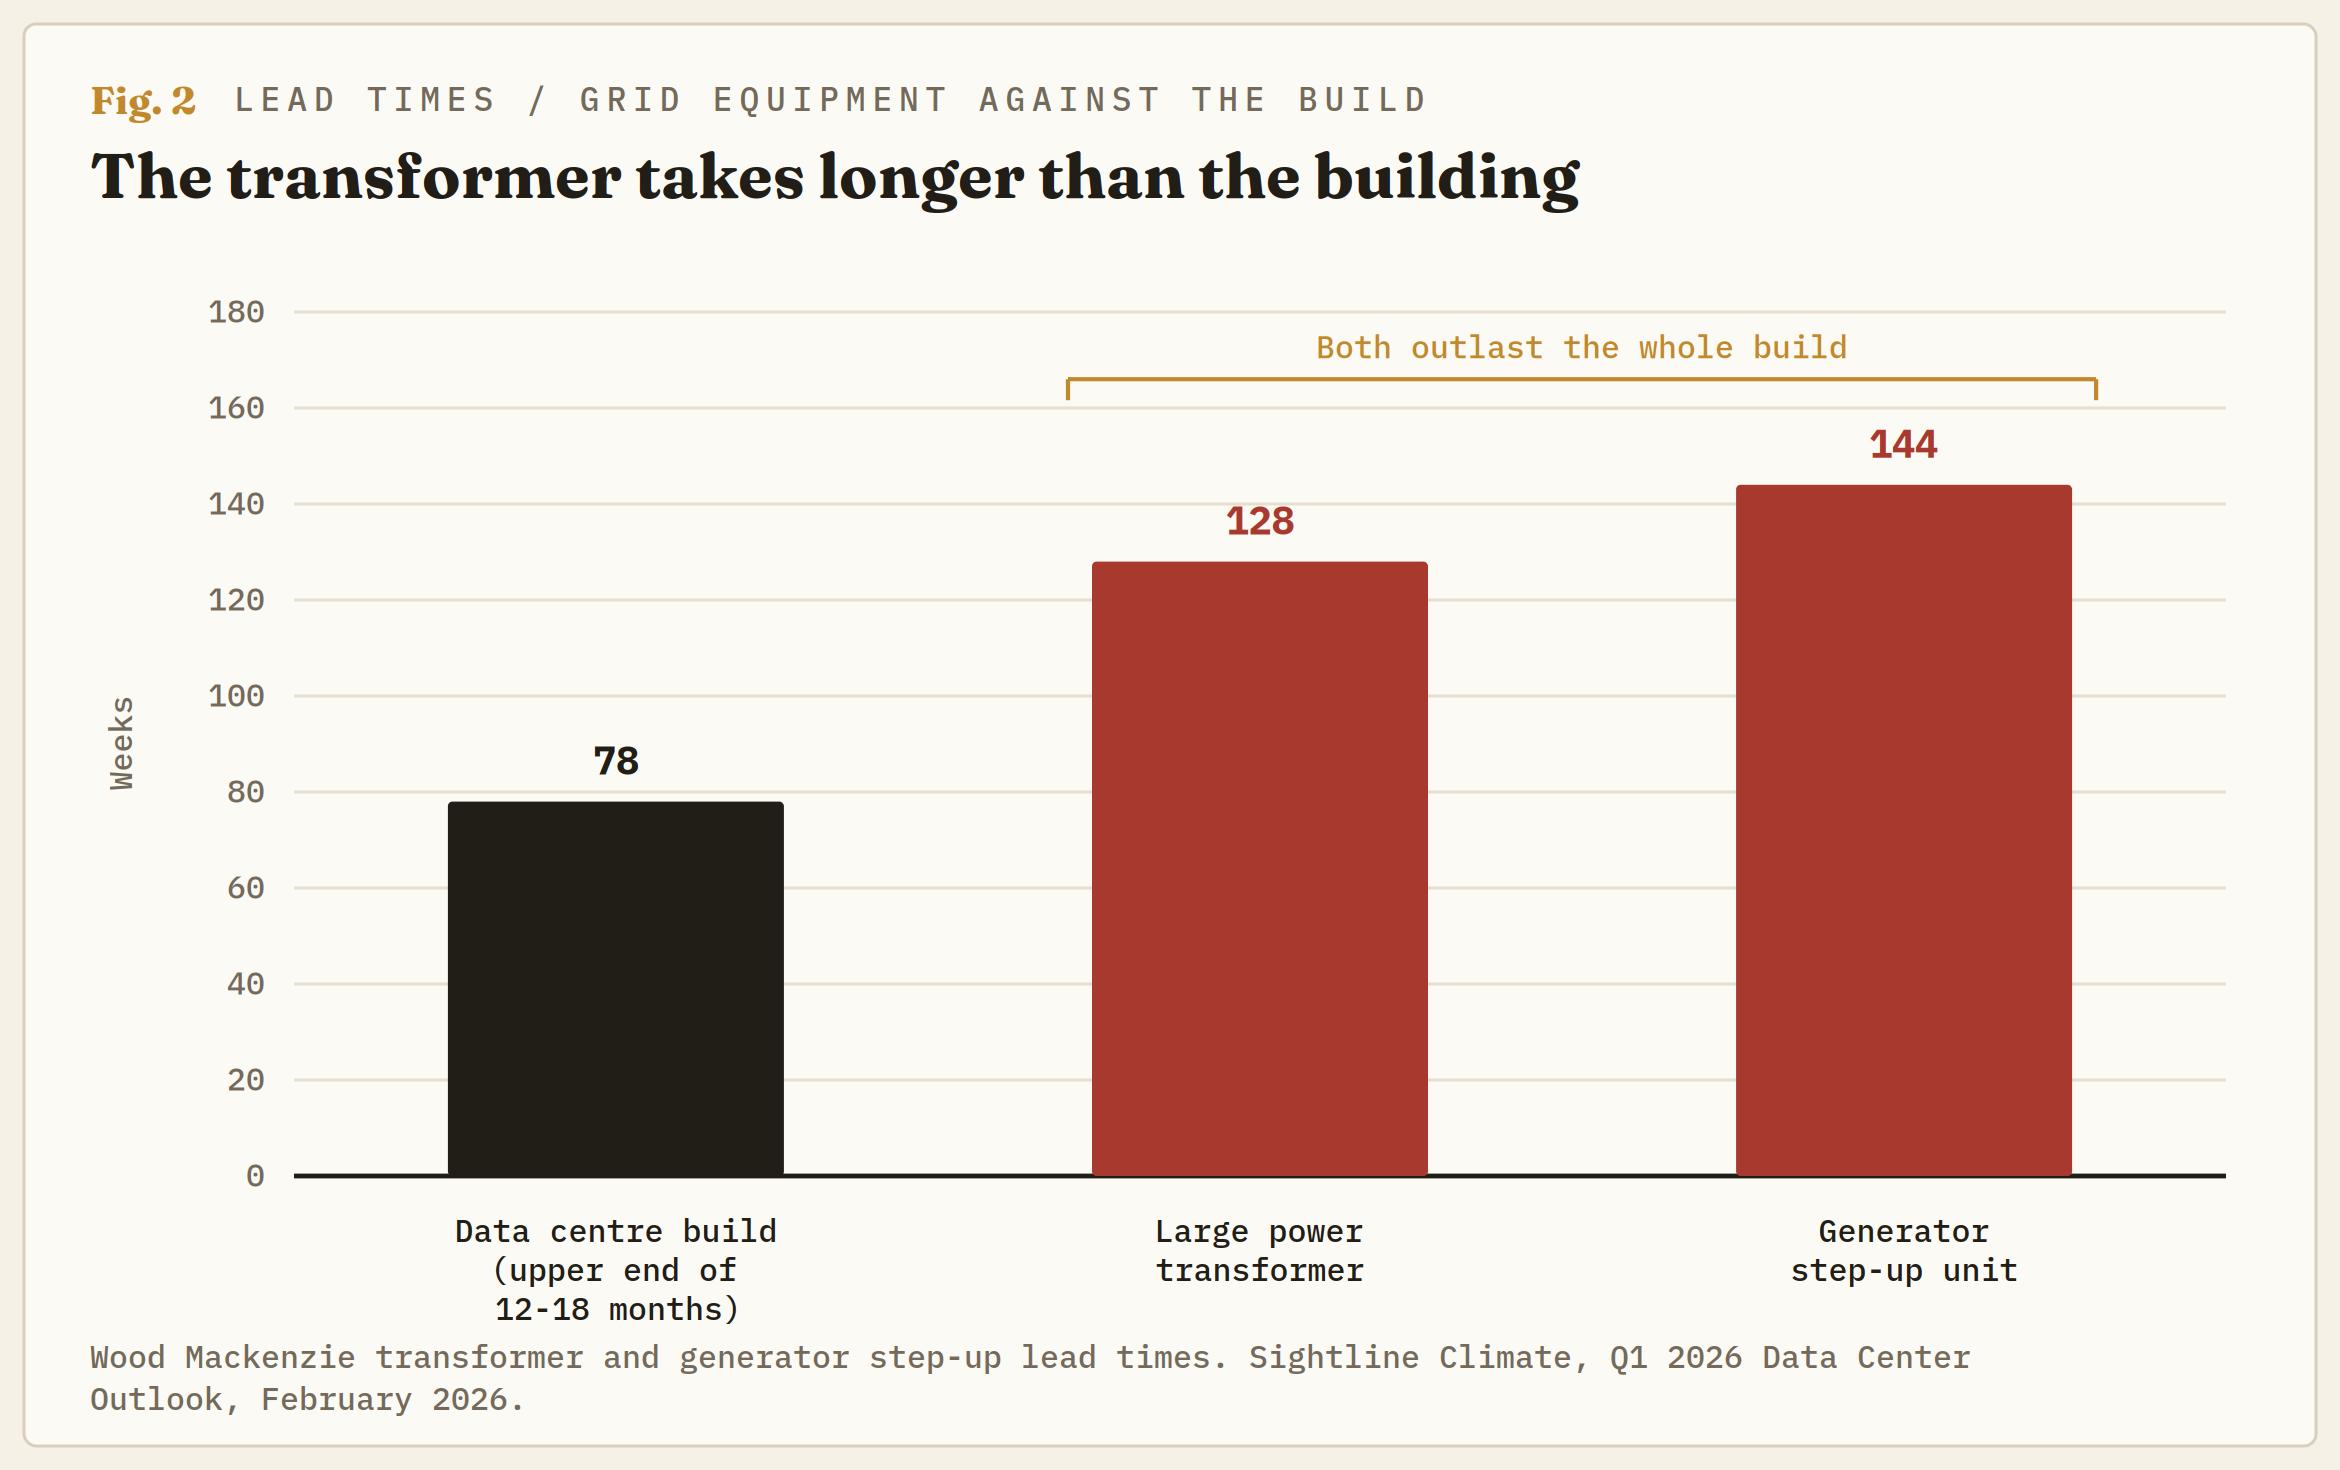
The most useful evidence is not in a report, it is on the tape, and it has been quietly carrying the signal for four months. Five companies that actually have to ship this equipment have been marked down hard from 2026 peaks: Vertiv (VRT) roughly 32% beneath an early May high, Siemens Energy (ENR) about 25% from early May, GE Vernova (GEV) near 23% off an early July peak, Quanta Services (PWR) close to 23% from early May, and Eaton (ETN) around 18% below an August high. Mean drawdown across the five is roughly 24%. All five sit well above their January lows, so this is a top rolling over rather than a collapse.
That is a verdict, and it points the opposite way from the consensus reading. A durable bottleneck pays its owner, because scarcity is pricing power and the queue is the moat. A bottleneck attached to projects that will not happen pays nobody, because the order is never placed. The names closest to the buildout topped first in early May and the most diversified electrical name held into August, so the rollover moved outward from the epicentre.
Set that against what happened to financing over the same stretch of road. Roughly $334 billion of AI-related bonds and loans had been raised by July, United States investment grade supply ran near $1.7 trillion through the same month at 27% above last year, and capex guidance went up, not down, at the second-quarter prints. Financing accelerated into a falling order book. Both groups cannot be right, and only one of them can see what is being ordered.
The wall has a date on it
Timing is the part everyone leaves vague, and there’s no need for it to be. Roughly $150-$200 billion capex originally slated for 2026 is expected to slip into 2027 and 2028. Data centre and merchant compute paper written across 2024 and 2025 was largely three- to five-year money, coming due across the same two-year stretch, and as much as three-quarters of data centre refinancing is expected to run through securitisation rather than through banks. Deferred spending and concentrated maturities arrive in the same window, into a market that had already absorbed $334 billion of this paper by July.
The sector prices its own clock more aggressively than the equity market does. AlixPartners found 68% of data centre executives expecting rising distress, two-thirds of them inside eighteen months, with lenders and investors more convinced than operators. Dated from July, that is two-thirds of an industry expecting visible distress by early 2028. Andrej Danis, a managing director there, framed it as a margin problem rather than a demand problem, which is the distinction the equity market keeps refusing to make.
Order the failure, and it is not the obvious sequence. The hyperscaler absorbs a two-year delay as a return on capital problem, because roughly one times debt to earnings before interest, tax, depreciation and amortisation (EBITDA) survives almost anything. The listed merchant clouds refinance widely and dilute. The unlisted developer holding a powered shell with no tenant and a floating rate facility does not get that far. That one breaks first, quietly, and it surfaces in a securitisation that prices badly rather than in a headline.
The strongest objection makes the case worse
Sightline Climate tracks 777 hyperscale projects above 50 megawatts announced since 2024, which skews toward large speculative announcements from developers with no delivery record, and satellite imagery suggests the under-construction figures understate reality. Fair, and worth saying plainly.
It does not dissolve the problem; it concentrates it. If slippage sits disproportionately among inexperienced developers running speculative sites, that is a precise description of the tier carrying floating-rate construction debt at 60-70% loan-to-cost with the thinnest lender base and no balance sheet propping it up. The aggregate can be fine while the marginal borrower is not. Nearly half of all tracked projects still have not disclosed how they intend to source power.
The 2025 cohort already ran this experiment. Of 110 projects slated for delivery, 26% were delayed, and a further 10% quietly moved their commissioning dates, and close to 6 gigawatts came online. Entering 2026, 11 of the 16 gigawatts slated for the year worldwide sat in the announced stage with no construction visible, against typical build times of 12-18 months. The arithmetic already ran out in January.
What resolves it
The fork is whether the 2027 slate converts or repeats. Sightline has 31.2 gigawatts pencilled for next year against 26.3 for 2028, and those totals mean something only to the extent construction starts appear behind them. Watch the construction share of the 2027 book, not the announced total.
Two observables date the answer. The six grid operators owed FERC their responses around the middle of August, and reading them for hardened readiness milestones and cost allocation is the cheapest work available, because hardening raises pre-energisation capital for every developer without a balance sheet behind it. And the equipment complex either makes a higher high from here or a lower one. A recovery through the May peaks says the orders are real and the drawdown was positioning. Failure beneath them says the order book has already seen the cancellations the announced pipeline will not admit to.
Position accordingly. Long the constraint only works if the constraint is being paid for, and for four months the tape has been saying it is not. The exposure is not the hyperscaler, whose balance sheet treats a two-year delay as an arithmetic problem. It is the developer paying double-digit carry on drawn construction debt, forbidden from withdrawing, and waiting on a transformer carrying a political import fee premium.
Author

Joshua Gibson
FXStreet
Joshua joins the FXStreet team as an Economics and Finance double major from Vancouver Island University with twelve years' experience as an independent trader focusing on technical analysis.
















