|

XOM stock finds buyers after Elliott Wave double three pattern

In this technical blog, we’re going to take a quick look at the Elliott Wave charts of Exxon Mobil Corporation (XOM) stock, published in the members’ area of the website.

Recently, XOM completed a three-wave structure from the peak, unfolding as an Elliott Wave Double Three pattern. The stock found buyers right at the Equal Legs zone. In the following analysis, we will examine the Elliott Wave structure in detail and present the key invalidation and target levels.

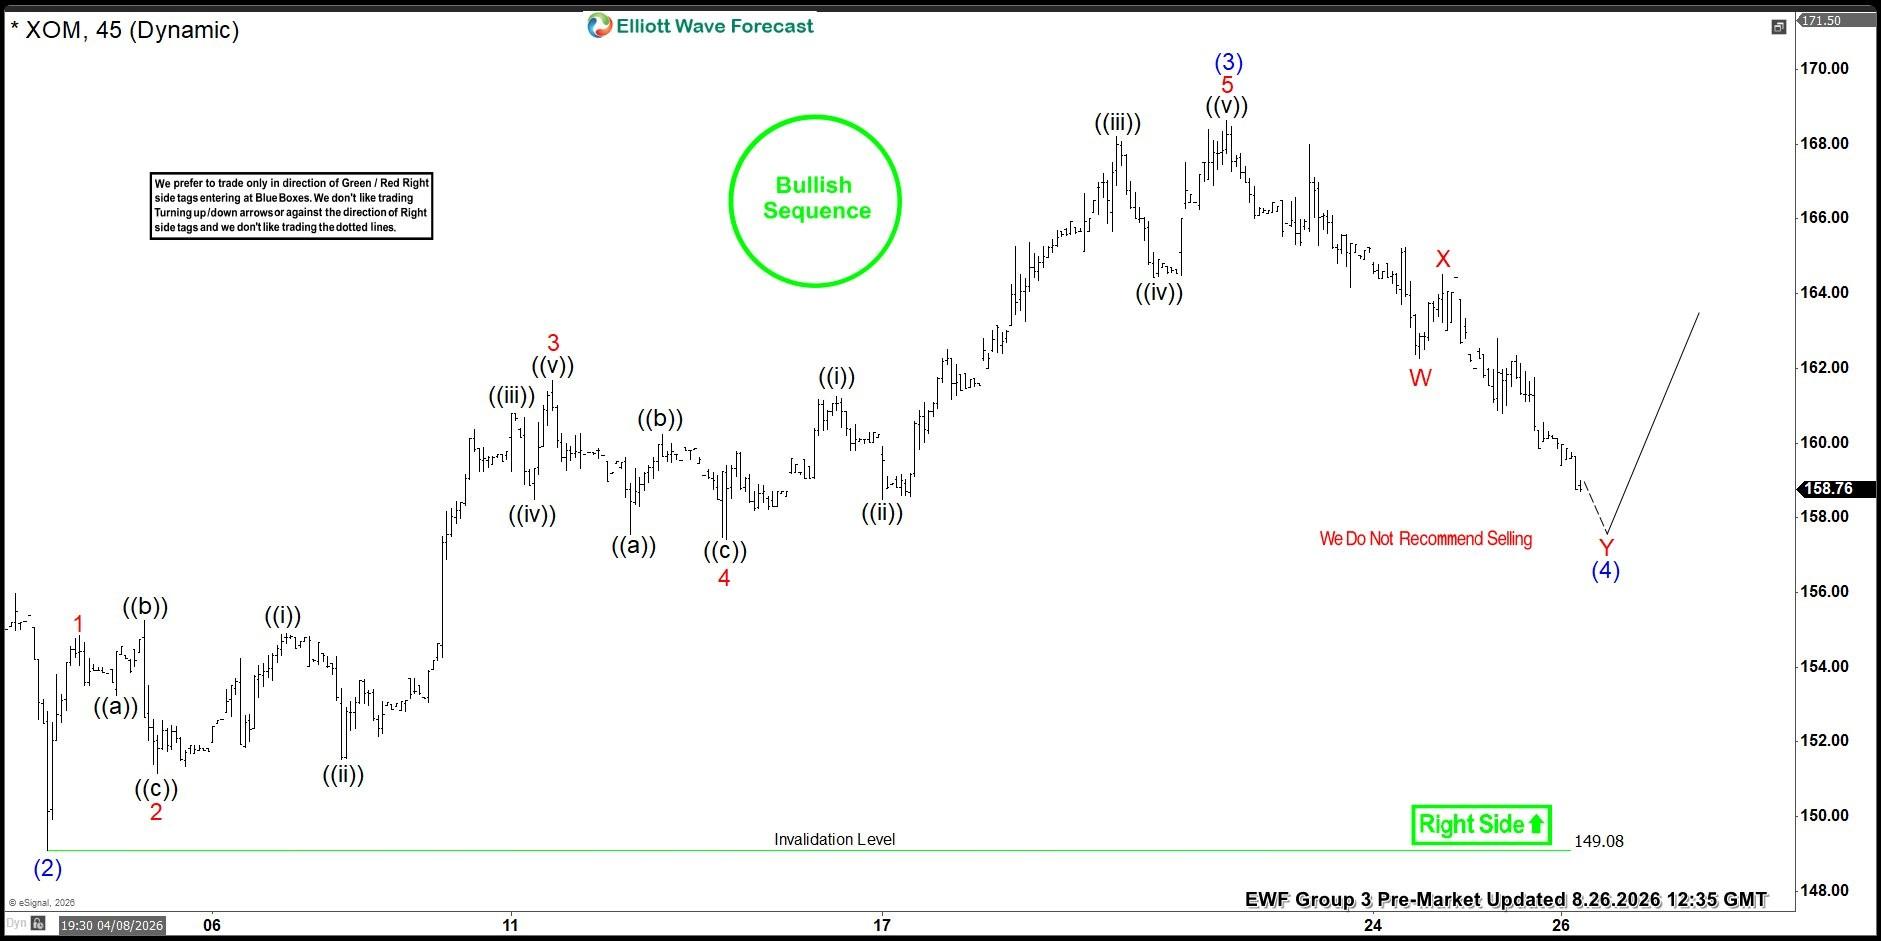
XOM Elliott Wave one-hour chart 08.26.2026

XOM stock is correcting the cycle from the 149.08 low. The price structure of the pullback looks incomplete at the moment. The current view suggests more short-term weakness before the next rally takes place.

As our members know, we identify the reversal/buying zone by measuring the W-X Equal Legs area using the Fibonacci Extension tool. In this case, the Equal Legs zone comes at 158.11–154.14. From this area, we expect buyers to step in and regain control, potentially driving the price higher in a three-wave bounce.
XOM

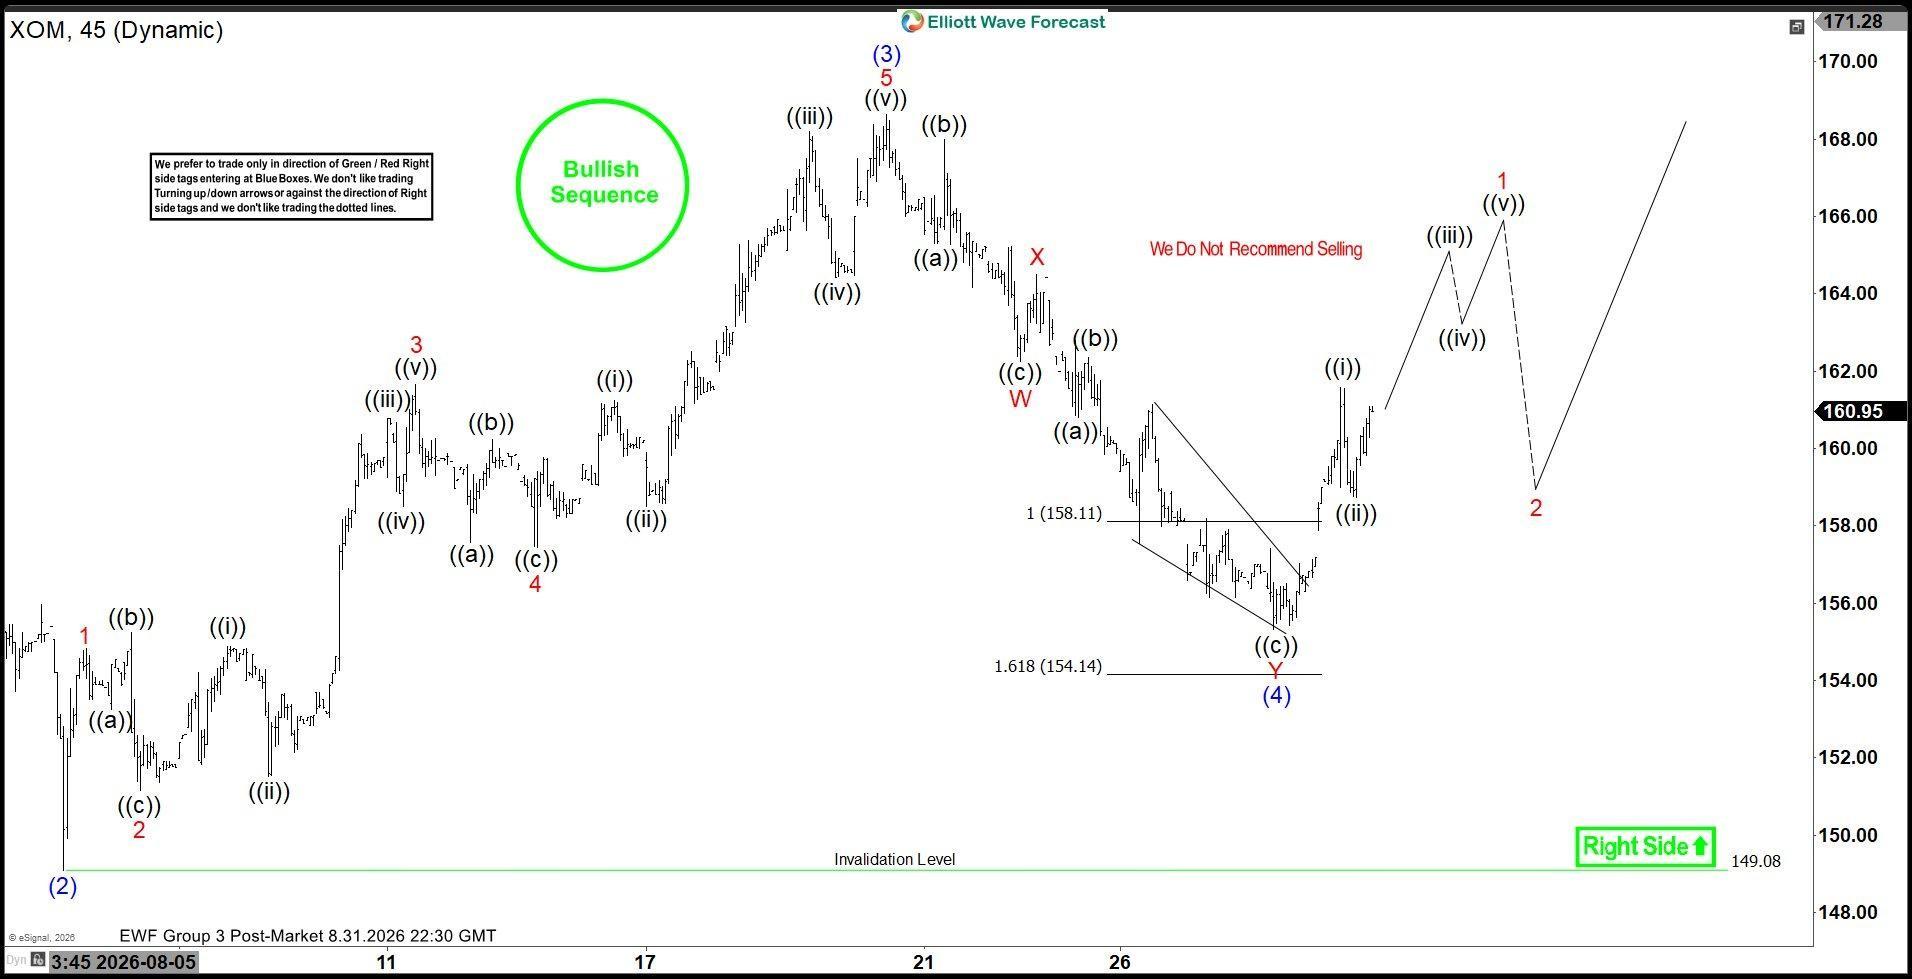
XOM Elliott Wave one-hour chart 08.31.2026

The stock found buyers at the Equal Legs zone, producing a solid reaction from that area. The pullback is counted complete at the 155.46 low. As a result, any long positions taken from the Equal Legs zone should be risk-free by now.

The rally from the Equal Legs zone looks impulsive, so we have labeled it as wave ((i)) of a new bullish sequence. The 155.46 low is the key level at this stage. As long as the price stays above that level, the next wave higher can be in progress, targeting the 171.6+ area.
XOM

Author

Elliott Wave Forecast Team

Elliott Wave Forecast Team

ElliottWave-Forecast.com

More from Elliott Wave Forecast Team
Share:

Editor's Picks

USD/JPY extends losses below 158.00 on hawkish BoJ repricing

USD/JPY extends losses below 158.00 in Asian trading on Thursday. Asian traders react negatively to the weak US ADP report, smashing the US Dollar across the board and exerting renewed selling pressure on the pair. Meanwhile, hawkish BoJ expectations and intervention risks continue to lend support to the Japanese Yen, rendering it negative for the major.

AUD/USD ranges above 0.7150 despite upbeat Chinese PMI

AUD/USD struggles to capitalize on the previous day's bounce from a nearly two-week low and ranges above 0.7150 in Asia on Thursday, as dismal Australian trade data counter upbeat China's RatingDog Services PMI. However, the pair's upside remains in check as the US Dollar stalls the weak ADP report-led slide amid escalating US-Iran tensions and firming September Fed rate-hike bets.

Gold looks to reclaim $4,450 on the road to recovery
Gold is building on its recovery from four-week troughs below $4,300, with buying aiming to recapture the key near-term resistance at around $4,450 early Thursday. Gold buyers seem to be back in the game after the daily technical setup turned in their favor after flashing bearish signals earlier in the week.
XRP defends key support, XLM awaits breakout as derivatives strengthen
Ripple (XRP) and Stellar (XLM) show divergent technical outlooks as traders assess whether the recent weakness could give way to a recovery. XRP is finding support and defining a key support zone, while XLM slips below a cluster of Exponential Moving Averages (EMAs).
US President Donald Trump: Renewed campaign against Iran will not continue for too long
US President Donald Trump said that while the US is prepared to strike Iran again at any time, he doesn’t expect the renewed fighting to last “too long,” Reuters reported on Wednesday. Iran’s Supreme Leader Mojtaba Khamenei said that Iran’s armed forces have “unforgettable lessons” in store for the US in his first message since fighting resumed after a month of relative calm.
Diesel’s record $100 warning: The oil shock hiding in plain sight

The Oil market may look calmer than it did a few months ago, but diesel is sending a very different message. The US diesel crack spread, the premium of ultra-low sulphur diesel futures over WTI, recently surged above $100 per barrel for the first time, reaching an intraday record of just over $102.00.
















