|

WTI Price Analysis: Retreats from two-month high, sellers need validation from $79.50

  • WTI steps back from multi-day high, pressured around intraday low.
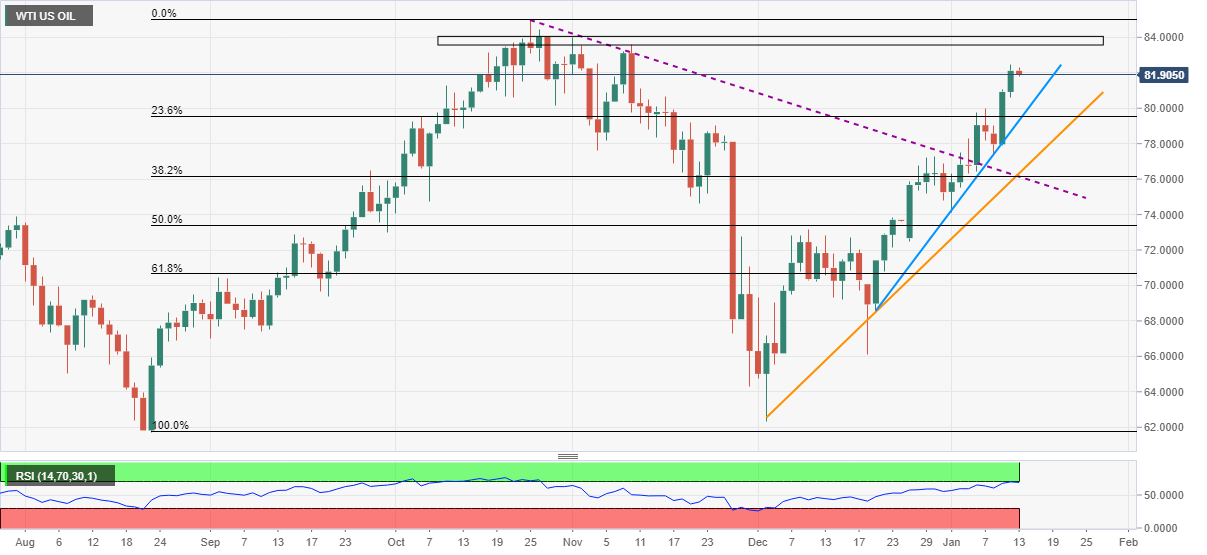
  • Overbought RSI triggers pullback but three-week-old support line, 23.6% Fibonacci retracement limits immediate downside.
  • Multiple levels since late October restricts immediate upside.

WTI crude oil buyers take a breather after a two-day uptrend near the highest level since early November. That said, the US oil benchmark drops 0.25% intraday while taking rounds to $81.90 of late.

Overbought RSI conditions triggered the WTI pullback from a multi-day high. However, the commodity’s further weakness remains doubtful until its stays beyond the $79.50 support confluence, comprising ascending trend line from December 21 and 23.6% Fibonacci retracement of August-October 2021 upside.

In a case where WTI drops below $79.50, January 10 swing low near $78.00 should return to the chart. Though, a convergence of the previous resistance line from October, a six-week-old upward sloping trend line and 38.2% Fibo level, near $76.15, becomes a tough nut to crack for the bears.

Meanwhile, the quote’s further upside will wait for the fresh multi-day high, currently around $82.50, before challenging a three-month-long horizontal area near $83.50-84.00.

Should oil prices rally past $84.00, the latest high surrounding $85.00 and the $90.00 psychological magnet will be on the trader’s radar.

To sum up, oil prices retreat but the bulls are not out of the woods yet.

WTI: Daily chart

Trend: Pullback expected

Additional important levels

Overview
Today last price81.89
Today Daily Change-0.22
Today Daily Change %-0.27%
Today daily open82.11
 
Trends
Daily SMA2075.51
Daily SMA5074.92
Daily SMA10075.27
Daily SMA20071.58
 
Levels
Previous Daily High82.48
Previous Daily Low80.61
Previous Weekly High79.97
Previous Weekly Low74.12
Previous Monthly High77.26
Previous Monthly Low62.34
Daily Fibonacci 38.2%81.76
Daily Fibonacci 61.8%81.33
Daily Pivot Point S180.99
Daily Pivot Point S279.87
Daily Pivot Point S379.13
Daily Pivot Point R182.85
Daily Pivot Point R283.59
Daily Pivot Point R384.71

Author

Anil Panchal

Anil Panchal

FXStreet

Anil Panchal has nearly 15 years of experience in tracking financial markets. With a keen interest in macroeconomics, Anil aptly tracks global news/updates and stays well-informed about the global financial moves and their implications.

More from Anil Panchal
Share:

Editor's Picks

AUD/USD eyes 0.7150 barrier nine-day EMA

AUD/USD inches higher after registering modest losses in the previous day, trading around 0.7130 during the Asian hours. The technical analysis of the daily chart indicates that the pair is moving sideways within the rectangle pattern, suggesting a consolidation as neither the bulls nor the bears have enough momentum to take control of the market.

USD/JPY trades below 160.00 intervention threshold; bullish bias intact

The USD/JPY pair attracts some sellers during the Asian session amid fears that authorities will step in again to prop up the Japanese Yen. Furthermore, the Israel-Lebanon truce prompts some profit-taking around the US Dollar and exerts downward pressure on the currency pair.

Gold puts its 200-day SMA to the test near $4,420

Gold keeps the bullish stance in place in the latter part of Thursday’s session, although a convincing break above the key $4,500 mark per troy ounce still remains elusive. The precious metal’s advance comes amid the resurgence of some selling interest around the Greenback, improving risk sentiment, and declining US Treasury yields across the board.

Bitcoin’s massive storm is back: Why the sell-off is far from over

Bitcoin price action over the last few weeks has felt less like a normal, healthy correction and more like a slow grinding crash that continues to wreak havoc on holdings and trading accounts. And everything suggests that the dramatic crash isn’t over.

Nonfarm payrolls: Testing the limits of Fed policy patience

The upcoming nonfarm payrolls report for May will provide the final update on the US labor market before Kevin Warsh attends his first policy meeting as the new Fed Chair later this month.

Recession on paper: What really moves the Canadian Loonie now?

Statistics Canada handed the headline writers a gift and the analysts a headache. Real GDP shrank 0.1% on an annualized basis in the first quarter, and with the fourth quarter of 2025 revised down to a 1.0% contraction, that is two negative quarters in a row, the textbook definition of a technical recession and Canada's first since the pandemic.