|

WTI Price Analysis: Drops towards monthly support around $74.00

  • WTI takes offers to refresh intraday low, prints two-day downtrend.
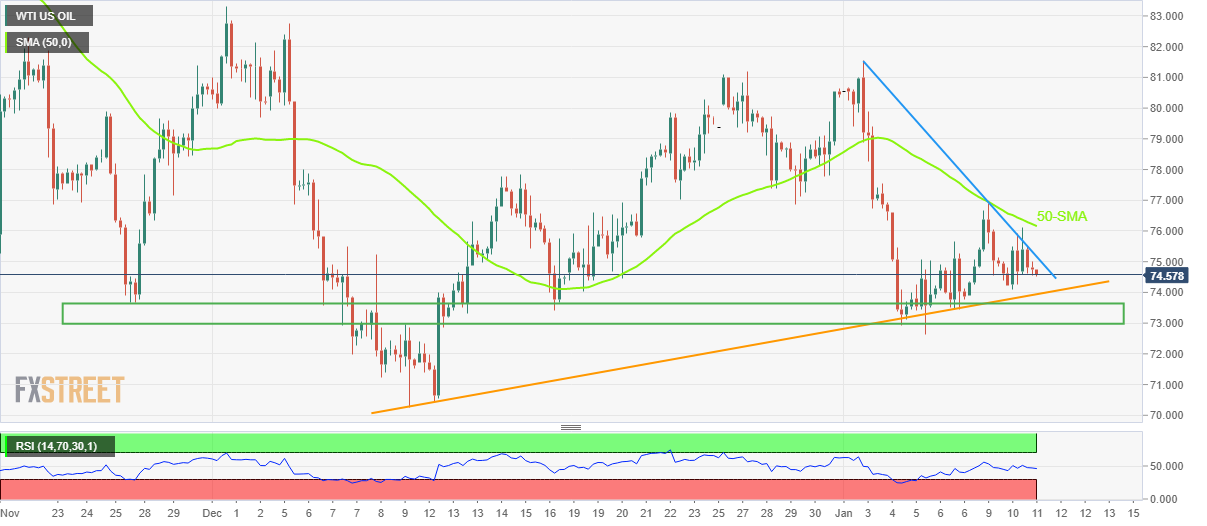
  • Failures to cross one-week-old descending trend line, 50-SMA favor sellers.
  • Bears need validation from $73.00 to keep the reins.

WTI crude oil remains depressed for the second consecutive day, down 0.80% intraday around $74.55 during early Wednesday in Europe.

The black gold’s latest weakness could be linked to its previous failures to cross the one-week-old resistance line, as well as the 50-bar Simple Moving Average (SMA). It’s worth noting that an absence of an oversold RSI (14) adds strength to the bearish bias.

However, an upward-sloping trend line support from early December, close to $74.00 at the latest, challenges the WTI sellers.

Even if the quote breaks the $74.00 support, a broad region comprising multiple levels marked since late November, between $73.60 and $73.00, appears a tough nut to crack for the crude oil bears.

In a case where the energy benchmark drops below $73.00 support, the odds of witnessing a slump toward the previous month’s low near $70.30, as well as an attack on the $70.00 psychological magnet, can’t be ruled out.

Alternatively, the weekly resistance line near $75.15 guards the quote’s immediate upside ahead of the 50-SMA level surrounding $76.15.

Following that, the $80.00 round figure and the monthly top of $81.55 could lure the WTI buyers.

Overall, WTI crude oil remains on the bear’s radar but the downside appears limited unless breaking the $73.00 level.

WTI: Four-hour chart

Trend: Limited downside expected

Additional important levels

Overview
Today last price74.58
Today Daily Change-0.64
Today Daily Change %-0.85%
Today daily open75.22
 
Trends
Daily SMA2077.13
Daily SMA5079.47
Daily SMA10082.75
Daily SMA20092.76
 
Levels
Previous Daily High76.12
Previous Daily Low74.09
Previous Weekly High81.56
Previous Weekly Low72.64
Previous Monthly High83.3
Previous Monthly Low70.27
Daily Fibonacci 38.2%75.34
Daily Fibonacci 61.8%74.86
Daily Pivot Point S174.17
Daily Pivot Point S273.11
Daily Pivot Point S372.13
Daily Pivot Point R176.2
Daily Pivot Point R277.18
Daily Pivot Point R378.24

Author

Anil Panchal

Anil Panchal

FXStreet

Anil Panchal has nearly 15 years of experience in tracking financial markets. With a keen interest in macroeconomics, Anil aptly tracks global news/updates and stays well-informed about the global financial moves and their implications.

More from Anil Panchal
Share:

Markets move fast. We move first.

Orange Juice Newsletter brings you expert driven insights - not headlines. Every day on your inbox.

By subscribing you agree to our Terms and conditions.

Editor's Picks

EUR/USD stays defensive below 1.1750 as USD finds its feet

EUR/USD kicks off the new week on a softer note, holding below 1.1750 in European trading on Monday. The pair faces challenges due to a pause in the US Dollar downtrend, with traders shifting their focus to the delayed US Nonfarm Payrolls and CPI data for fresh directives. The ECB policy decision is also eagerly awaited. 

GBP/USD holds steady above mid-1.3300s as traders await key data and BoE this week

The GBP/USD pair remains on the defensive during the Asian session on Monday, though it lacks bearish conviction and holds above the 200-day Simple Moving Average pivotal support. Spot prices currently trade around the 1.3360 region, nearly unchanged for the day.

Gold climbs to seven-week highs on Fed rate cut bets, safe-haven demand

Gold price rises to seven-week highs to near $4,350 during the early European trading hours on Monday. The precious metal extends its upside amid the prospect of interest rate cuts by the US Fed next year. Lower interest rates could reduce the opportunity cost of holding Gold, supporting the non-yielding precious metal.

Solana consolidates as spot ETF inflows near $1 billion signal institutional dip-buying

Solana price hovers above $131 at the time of writing on Monday, nearing the upper boundary of a falling wedge pattern, awaiting a decisive breakout. On the institutional side, demand for spot Solana Exchange-Traded Funds remained firm, pushing total assets under management to nearly $1 billion since launch. 

Big week ends with big doubts

The S&P 500 continued to push higher yesterday as the US 2-year yield wavered around the 3.50% mark following a Federal Reserve (Fed) rate cut earlier this week that was ultimately perceived as not that hawkish after all. The cut is especially boosting the non-tech pockets of the market.

Solana Price Forecast: SOL consolidates as spot ETF inflows near $1 billion signal institutional dip-buying

Solana (SOL) price hovers above $131 at the time of writing on Monday, nearing the upper boundary of a falling wedge pattern, awaiting a decisive breakout.