|

WTI Price Analysis: Drops towards $83.00 on breaking monthly support line

  • WTI drops for the second consecutive day, refreshes intraday low.
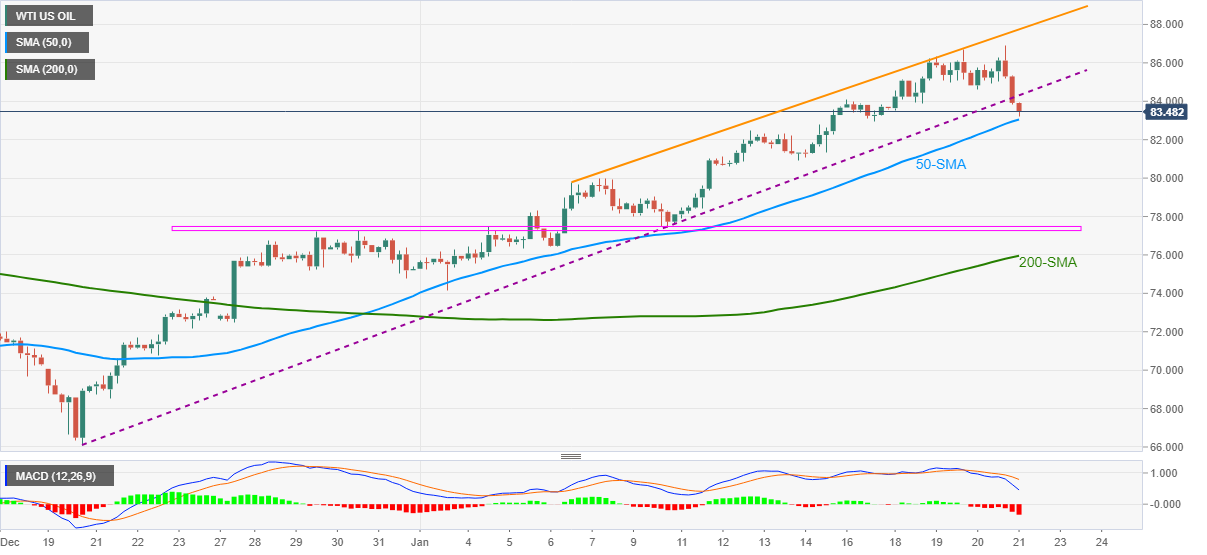
  • Bearish MACD signals, support break favor sellers to attack 50-SMA.
  • Monthly horizontal support, 200-SMA adds to the downside filters.

WTI crude oil extends the previous day’s pullback from multi-day top towards breaking short-term key support, refreshing intraday low near $83.50 during Friday’s Asian session. In doing so, the black gold drops 1.42% intraday by the press time.

Given the commodity’s clear downside break of the monthly trend line, coupled with the bearish MACD signals, WTI prices are likely to remain pressured towards the 50-SMA level of $83.00.

It should be noted, however, that the quote’s sustained downside past $83.00 makes it vulnerable to test the $80.00.

Though, the monthly horizontal area around $77.50-25 and the 200-SMA level of $75.95 will challenge the oil bears afterward.

On the flip side, corrective pullback needs to stay beyond the previous support line, around $84.25 at the latest, to convince the commodity buyers.

Following that, the eight-year high flashed on Thursday, near $87.00 and an ascending resistance line from January 06, near $87.75, will test the energy bulls targeting the $90.00 psychological magnet.

WTI: Four-hour chart

Trend: Further weakness expected

Additional important levels

Overview
Today last price83.3
Today Daily Change-1.21
Today Daily Change %-1.43%
Today daily open84.51
 
Trends
Daily SMA2079.23
Daily SMA5075.31
Daily SMA10076.19
Daily SMA20072.27
 
Levels
Previous Daily High86.93
Previous Daily Low84.42
Previous Weekly High83.74
Previous Weekly Low77.44
Previous Monthly High77.26
Previous Monthly Low62.34
Daily Fibonacci 38.2%85.38
Daily Fibonacci 61.8%85.97
Daily Pivot Point S183.64
Daily Pivot Point S282.77
Daily Pivot Point S381.13
Daily Pivot Point R186.15
Daily Pivot Point R287.8
Daily Pivot Point R388.67

Author

Anil Panchal

Anil Panchal

FXStreet

Anil Panchal has nearly 15 years of experience in tracking financial markets. With a keen interest in macroeconomics, Anil aptly tracks global news/updates and stays well-informed about the global financial moves and their implications.

More from Anil Panchal
Share:

Editor's Picks

AUD/USD falls to near 0.7100 after slipping below 50-day EMA

AUD/USD depreciates after registering minor gains in the previous day, trading around 0.7120 during the Asian hours. The technical analysis of the daily chart shows the pair consolidating sideways within a rectangle pattern, as neither bulls nor bears gain control. The AUD/USD pair is holding a slight bearish tone however as it sits beneath both the nine-day and 50-day EMAs.

160.00: USD/JPY back near intervention territory after upbeat US jobs report

US Nonfarm Payrolls beat expectations by a wide margin in May, with 172K jobs added. The US Dollar rebounds after the release, helping USD/JPY recover from its intraday lows. Warnings from Japanese authorities continue to limit upside potential near the 160.00 threshold.

Gold targets $4,300 amid stronger Dollar

Gold faces increasing selling interest and navigates the area of three-month lows near the $4,300 mark per troy ounce on Friday. The precious metal’s decline comes as traders assess the stronger-than-expected NFP, while the bid bias in the Greenback and higher US Treasury yields also collaborate with the retracement.

Cardano hits five-year low even as Hoskinson clarifies "break" isn't an exit

Cardano (ADA) price is down 10% at press time on Friday, extending losses over 30% so far this week amid Charles Hoskinson's clarification that "break" isn't an exit.

Week ahead – Fed countdown begins amid US inflation data and geopolitical risks

Fed Chair Warsh’s first meeting approaches as key US inflation data could reshape expectations. Oil prices remain elevated as US-Iran talks continue; tariffs also return to the spotlight. ECB is expected to hike; will it be a one-off move or is July live?

The US economy defies the rules: 100 days into the Oil shock and the recession signal is still missing

More than three months after the start of the Iran war and the resulting disruption to global energy markets, the US economy continues to display remarkable resilience. The conflict has triggered a sharp rise in Oil prices, reignited inflationary pressures and fueled widespread concerns about a potential economic slowdown.