WTI Price Analysis: Drops to test 100-HMA once again, API in focus


  • WTI fails to sustain the uptrend above $69, turns into the red zone.
  • The US oil challenges the key 100-HMA support at $68.19.
  • Bearish RSI suggests more losses in the offing, with eyes on API data.

WTI (NYMEX futures) is snapping its two-day advance on Tuesday, reversing towards the $68 mark, as investors assess the impact of the hurricane IDA ahead of Thursday’s OPEC+ meeting.

The black gold is shrugging off the broad US dollar weakness, as profit-booking seems to be the main theme heading into the American Petroleum Institute’s (API) weekly crude stockpiles data.

From a short-term technical perspective, WTI bears are back in control after the bulls failed to find acceptance above the $69 threshold earlier this Tuesday.

The renewed downside pressure knocked off WTI firmly below the horizontal 21 and 50-hourly moving averages (HMA), as the bears now challenge the ascending 100-HMA at $68.19.

The risks remain to the downside, as the Relative Strength Index (RSI) is pointing south below the midline.   

If the 100-HMA support gives way, then a drop towards Monday’s low of $67.6 remains inevitable.

Further south, the upward-sloping 200-HMA at $66.35 could be on the sellers’ radar.

WTI: Hourly chart

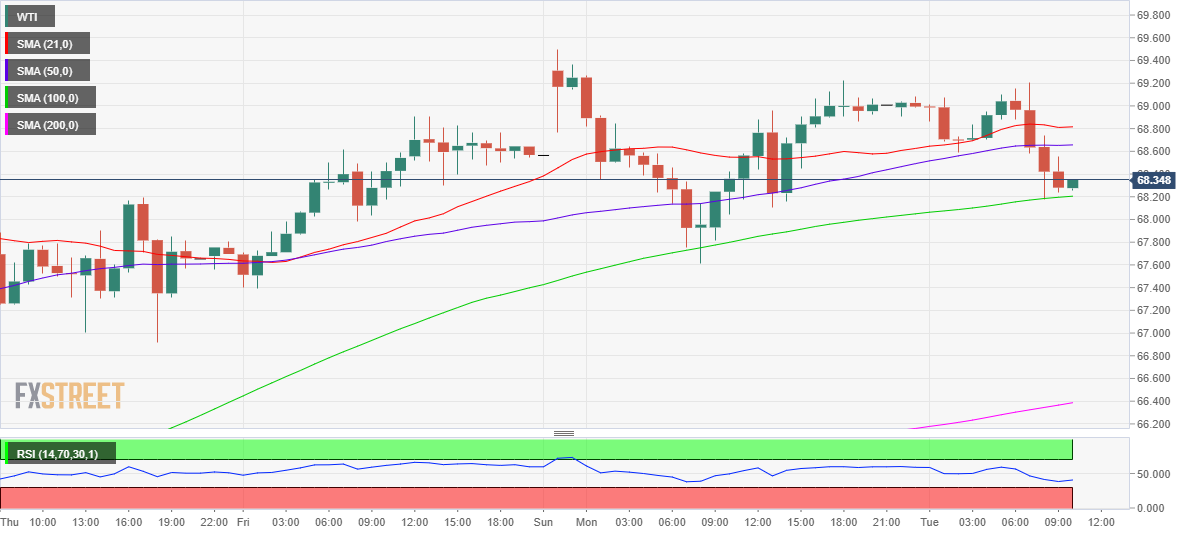
On the upside, acceptance above the 50-HMA at $68.65 to recapture the 21-HMA hurdle at $68.81.

However, only an hourly close above the $69 mark could call for a sustained upswing towards the $70 psychological level.

WTI: Additional levels to watch

WTI

Overview
Today last price 68.29
Today Daily Change -0.73
Today Daily Change % -1.06
Today daily open 69.01
 
Trends
Daily SMA20 67.23
Daily SMA50 70.32
Daily SMA100 68.16
Daily SMA200 61.46
 
Levels
Previous Daily High 69.5
Previous Daily Low 67.61
Previous Weekly High 68.91
Previous Weekly Low 61.73
Previous Monthly High 76.4
Previous Monthly Low 64.99
Daily Fibonacci 38.2% 68.78
Daily Fibonacci 61.8% 68.33
Daily Pivot Point S1 67.92
Daily Pivot Point S2 66.82
Daily Pivot Point S3 66.03
Daily Pivot Point R1 69.8
Daily Pivot Point R2 70.6
Daily Pivot Point R3 71.69


Share: Feed news

Information on these pages contains forward-looking statements that involve risks and uncertainties. Markets and instruments profiled on this page are for informational purposes only and should not in any way come across as a recommendation to buy or sell in these assets. You should do your own thorough research before making any investment decisions. FXStreet does not in any way guarantee that this information is free from mistakes, errors, or material misstatements. It also does not guarantee that this information is of a timely nature. Investing in Open Markets involves a great deal of risk, including the loss of all or a portion of your investment, as well as emotional distress. All risks, losses and costs associated with investing, including total loss of principal, are your responsibility. The views and opinions expressed in this article are those of the authors and do not necessarily reflect the official policy or position of FXStreet nor its advertisers. The author will not be held responsible for information that is found at the end of links posted on this page.

If not otherwise explicitly mentioned in the body of the article, at the time of writing, the author has no position in any stock mentioned in this article and no business relationship with any company mentioned. The author has not received compensation for writing this article, other than from FXStreet.

FXStreet and the author do not provide personalized recommendations. The author makes no representations as to the accuracy, completeness, or suitability of this information. FXStreet and the author will not be liable for any errors, omissions or any losses, injuries or damages arising from this information and its display or use. Errors and omissions excepted.

The author and FXStreet are not registered investment advisors and nothing in this article is intended to be investment advice.

Recommended content


Recommended content

Editors’ Picks

EUR/USD clings to daily gains above 1.0650

EUR/USD clings to daily gains above 1.0650

EUR/USD gained traction and turned positive on the day above 1.0650. The improvement seen in risk mood following the earlier flight to safety weighs on the US Dollar ahead of the weekend and helps the pair push higher.

EUR/USD News

GBP/USD recovers toward 1.2450 after UK Retail Sales data

GBP/USD recovers toward 1.2450 after UK Retail Sales data

GBP/USD reversed its direction and advanced to the 1.2450 area after touching a fresh multi-month low below 1.2400 in the Asian session. The positive shift seen in risk mood on easing fears over a deepening Iran-Israel conflict supports the pair.

GBP/USD News

Gold holds steady at around $2,380 following earlier spike

Gold holds steady at around $2,380 following earlier spike

Gold stabilized near $2,380 after spiking above $2,400 with the immediate reaction to reports of Israel striking Iran. Meanwhile, the pullback seen in the US Treasury bond yields helps XAU/USD hold its ground.

Gold News

Bitcoin Weekly Forecast: BTC post-halving rally could be partially priced in Premium

Bitcoin Weekly Forecast: BTC post-halving rally could be partially priced in

Bitcoin price shows no signs of directional bias while it holds above  $60,000. The fourth BTC halving is partially priced in, according to Deutsche Bank’s research. 

Read more

Week ahead – US GDP and BoJ decision on top of next week’s agenda

Week ahead – US GDP and BoJ decision on top of next week’s agenda

US GDP, core PCE and PMIs the next tests for the Dollar. Investors await BoJ for guidance about next rate hike. EU and UK PMIs, as well as Australian CPIs also on tap.

Read more

Forex MAJORS

Cryptocurrencies

Signatures