|

WTI Price Analysis: Battles $59 mark amid impending death cross on 1H chart

  • WTI sees a dead cat bounce amid bearish RSI, potential death cross.  
  • The US oil could face stiff resistance at the bearish 21-HMA at $59.66.
  • Markets await the API crude stocks data for fresh impetus.

WTI (futures on NYMEX) is attempting a minor recovery around the $59 mark, although the risks remain skewed to the downside amid bearish fundamental as well as technical factors.

The US oil tumbled on Monday, despite the sell-off in the US dollar across the board, as rising oil supplies from OPEC and its allies as well as from Iran weighed heavily on the commodity.

All eyes now remain on the American Petroleum Institute’s (API) weekly crude supplies report due later on Tuesday for the next direction in prices.

From a near-term technical perspective, the recovery in the WTI barrel appears to fizzle out just above the $59 threshold, as the Relative Strength Index (RSI) continues to remain in the bearish region on the hourly chart.

Adding credence to the downbeat outlook, the price has witnessed a bear cross earlier in the day, as the 21-hourly moving average (HMA) pierced through the 50 and 200-HMAs from above.

Further, a looming death cross, represented by the 50-DMA cutting the 200-HMA from above, also keeps the sentiment in favor of the oil bears.

Therefore, the US oil could drop back towards Monday’s low of $57.66 if the sellers regain control.

Ahead of that, the bears could challenge the $58 threshold.

If Monday’s low is cleared then March lows of $57.27 could be on the sellers’ radars.

WTI one-hour chart

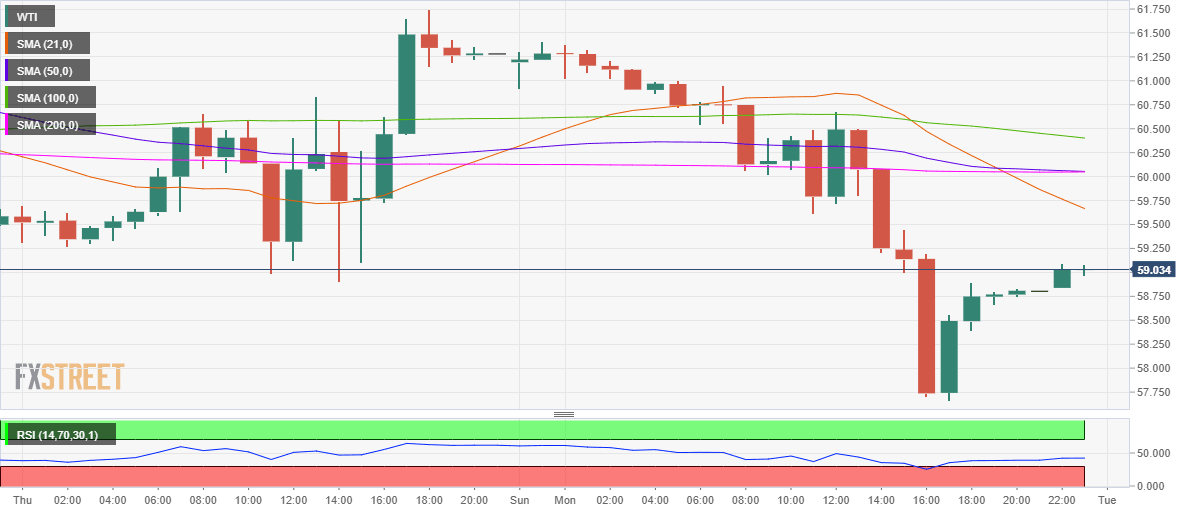
On the flip side, WTI faces immediate resistance at the downward-pointing 21-HMA at $59.66.

The next relevant barrier is seen at the $60 mark (50 and 200-HMAs convergence), above which the 100-HMA at $60.40 could be challenged.

WTI additional levels

WTI

Overview
Today last price59.02
Today Daily Change-2.26
Today Daily Change %-3.69
Today daily open61.29
 
Trends
Daily SMA2062.42
Daily SMA5059.78
Daily SMA10053.69
Daily SMA20047.1
 
Levels
Previous Daily High61.74
Previous Daily Low58.9
Previous Weekly High62.25
Previous Weekly Low58.88
Previous Monthly High67.87
Previous Monthly Low57.27
Daily Fibonacci 38.2%60.66
Daily Fibonacci 61.8%59.99
Daily Pivot Point S159.54
Daily Pivot Point S257.8
Daily Pivot Point S356.7
Daily Pivot Point R162.39
Daily Pivot Point R263.49
Daily Pivot Point R365.23

Author

Dhwani Mehta

Dhwani Mehta

FXStreet

Residing in Mumbai (India), Dhwani is a Senior Analyst and Manager of the Asian session at FXStreet. She has over 10 years of experience in analyzing and covering the global financial markets, with specialization in Forex and commodities markets.

More from Dhwani Mehta
Share:

Editor's Picks

EUR/USD sticks to positive bias above 1.1800 as trade jitters undermine USD

The EUR/USD pair builds on the previous day's modest gains and attracts some buyers for the second straight day on Thursday amid a softer US Dollar. Spot prices, however, lack bullish conviction and trade around the 1.1815-1.1820 area during the Asian session, up 0.10% for the day.

GBP/USD bounces as soft CPI boosts BoE cut bets

GBP/USD rose 0.42% on Wednesday, recovering toward 1.3600 in a session shaped by softer-than-expected UK inflation data and broad US Dollar weakness. The pair had been consolidating in a tight range between about 1.3450 and 1.3520 for the past few days following the sharp pullback from the late-January high near 1.3870, and Wednesday's move pushed price action back onto the high side of key moving averages.

Gold retains positive bias amid sustained safe-haven demand, softer USD

Gold attracts some buyers for the second straight day as trade jitters and geopolitical tensions ahead of the US-Iran nuclear talks underpin demand for safe-haven assets. Apart from this, a softer US Dollar further supports the bullion, though the underlying bullish sentiment could cap gains. Bulls might also opt to wait for acceptance above the $5,200 mark before positioning for any meaningful appreciating move.

AUD/USD rises toward three-year highs on RBA rate hike bets

AUD/USD remains stronger for the third successive session, trading around 0.7120 during the Asian hours on Thursday. The pair advances toward its three-year high of 0.7147, last touched on February 12, as the Australian Dollar strengthens following hotter-than-expected inflation data from Australia, reinforcing expectations of further interest rate hikes by the Reserve Bank of Australia this year.

Nvidia delivers another monster earnings report, and forecasts big things to come

It was another monster earnings report from Nvidia for fiscal Q4. Revenues were $68.1bn, smashing estimates of $65bn. Gross profit margin was a healthy 75%, up from 73.5% in the prior quarter, and the outlook for this quarter was monstrous.

Cosmos Hub Price Forecast: ATOM rebounds slightly, bearish outlook remains intact

Cosmos Hub (ATOM) price rebounds, trading above $2.05 at the time of writing on Wednesday, after undergoing a sharp correction since last week. Weakening on-chain and derivatives data support a bearish outlook, while technical analysis remains unfavorable.