|

WTI Crude: The monthly chart is telling a bigger story

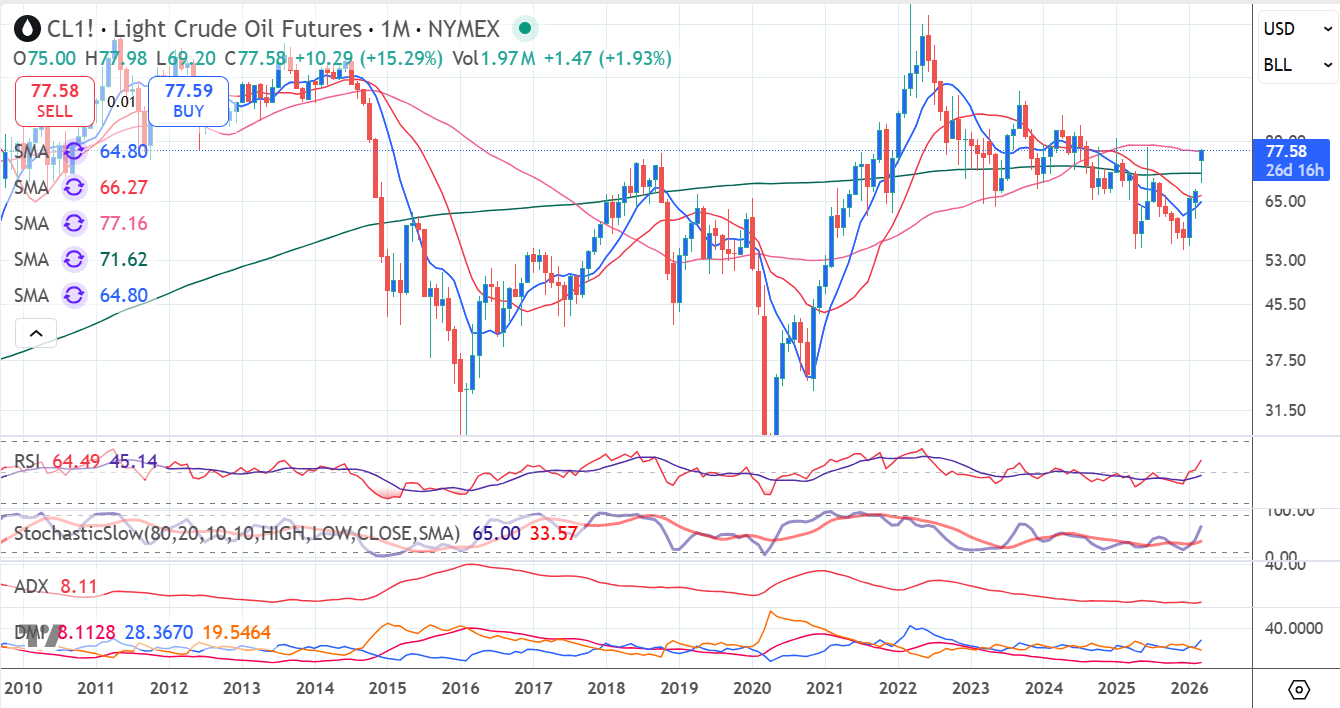
I’m sharing this monthly WTI chart not for hour‑to‑hour trading decisions, but to highlight the structural shift taking place in Oil. The long‑term picture has been building for months, and the market is finally starting to confirm it.

WTI completed a Double Bottom on the monthly timeframe between April and December 2025 — a formation I highlighted several weeks ago as a major bullish foundation. January then delivered a Reversal Month, signalling that the market was preparing for a broader move higher.

This week, that move finally accelerated.

Key technical developments

  • WTI has now broken above the 200‑month moving average, a significant long‑term trend indicator.
  • Price is currently edging above the 55‑month moving average at $77.16, reinforcing the shift in momentum.
  • From a structural perspective, Oil still has considerable room to the upside, with $88–$89 emerging as the broader long‑term target.

Why the 38.2% Fibonacci level matters

The 38.2% long‑term Fibonacci retracement sits at $81.70, and this level is critical.

Long‑term investors and funds use the monthly Fib structure for entry and exit clarity, especially following a completed Double Bottom.

I expect WTI to gravitate toward $81.70 in the coming weeks.

This is where:

  • Profit‑taking will naturally emerge.
  • Counter‑trend sellers will step in.
  • Momentum will be tested.

A clean break above this level would strengthen the case for the $88–$89 target zone.

Short‑term considerations

Despite the strong momentum:

There is an open gap at $67.85, and markets rarely ignore gaps forever.

Overbought/oversold indicators should be monitored closely.

The $80.00 psychological level will act as a natural magnet and initial cap — traders love round numbers, and positioning often clusters around them.

Bottom line

The long‑term structure in WTI is turning decisively higher.

The Double Bottom, the Reversal Month, and the break above major monthly moving averages all point to a market transitioning into a new phase.
WTI

Author

Carol Harmer

Carol Harmer

Charmer Trading

Carol Harmer has over 39 years experience of analysing and trading the world's markets and is undoubtedly one of the most respected technical trader in the world today.


More from Carol Harmer
Share:

Editor's Picks

GBP/USD keeps the bid bias near 1.3550

GBP/USD leaves behind part of the recent three-day retracement and hovers around the 1.3550 region on Monday. The Greenback’s fresh downward trend helps Cable and the rest of the risk complex recoup part of the recent ground lost while attention remains on the potential Fed rate path.

EUR/USD retakes 1.1600; looks at the 200-day SMA

EUR/USD manages to gather fresh steam and advances past the 1.1600 hurdle as Monday’s NA session draws to a close. Indeed, the pair patially reverses Friday’s sharp retracement amid the renewed downside momentum in the US Dollar. Moving forward, the flash Inflation Rate in the euro zone and US JOLTs and the ISM Manufacturing should keep investors entertained on turnaround Tuesday.

Gold: Is the bullish run over?

Gold adds to Friday’s marked decline, although it has managed to bounce off earlier lows in the sub-$4,400 region per troy ounce on Monday. The yellow metal’s pullback comes despite the softer stance in the US Dollar and steady uncertainty in the Middle East, although rising yields keep bulls at bay for now.

Bitcoin and Gold Outlook: BTC clings to support, XAU slides as US-Iran tensions re-escalate
Bitcoin (BTC) maintains stability above $78,000 support on Monday as crypto prices broadly consolidate. Gold (XAU/USD), meanwhile, holds above $4,400, marking two consecutive days of declines. Sentiment in the broader cryptocurrency market remains broadly positive, with the Fear & Greed Index holding at 62 on Monday, down slightly from 69 the previous day.
Oil rallies on fresh persian gulf strikes
Energy prices are trading firmer this morning after the US carried out targeted strikes against Iran, drawing retaliatory strikes and reinforcing concerns about a prolonged stalemate in the Persian Gulf. Oil prices started the week stronger following the first military strikes between the US and Iran in a month. ICE Brent briefly moved back above US$90/bbl in early morning Asia trading.
Diesel’s record $100 warning: The oil shock hiding in plain sight

The Oil market may look calmer than it did a few months ago, but diesel is sending a very different message. The US diesel crack spread, the premium of ultra-low sulphur diesel futures over WTI, recently surged above $100 per barrel for the first time, reaching an intraday record of just over $102.00.















