Where could this bear market rally peak? [Video]
![Where could this bear market rally peak? [Video]](https://editorial.fxstreet.com/images/Markets/Equities/Nasdaq/new-york-stock-exchange-18404353_XtraLarge.jpg)
Since the bullish momentum bar reacting the CPI on 10 Nov 2022, S&P 500 has been trending up without threatening price action and excessive supply. Despite the long term direction is still down together with the gloomy macro, the price action and the volume still suggest the least resistance path is up based on the Wyckoff trading method.
Watch the video below to find out where could this bear market rally peak and what to expect next for a bearish scenario and at what point could it be violated.
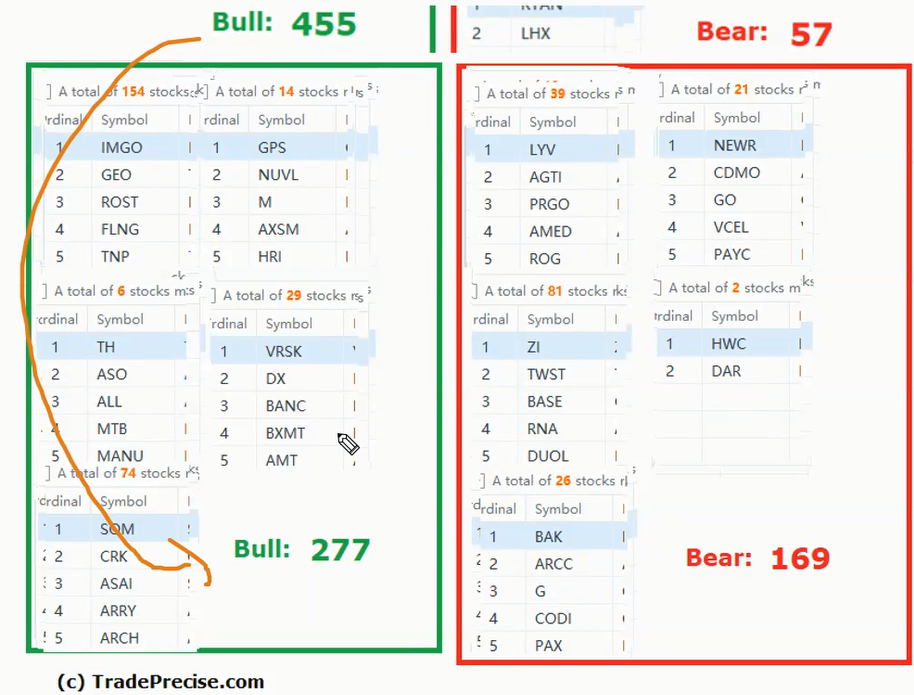
The bullish setup vs. the bearish setup is 277 to 169 from the screenshot of my stock screener below.
If you are a long term investor and waiting to spot a stock market bottom, there is likely more work to be done as shown in the market structure. Yet, there are more than enough outperforming stocks with low risk entry when you know how to identify the winning stocks for swing trading. The key is to be nimble with conservative trade management.
Author

Ming Jong Tey
Independent Analyst
Ming Jong Tey has been trading since 2008. He started his learning journey from technical analysis (indicators, Fibonacci, etc...) to value investing. Throughout his journey, he develops an interest in price action with chart pattern trading.


