Western Digital (WDC) tests patient bears, will the third time be the charm?

Western Digital Corporation (WDC), the data storage solutions giant behind everything from hard drives to flash memory, just handed swing traders a textbook example of why patience pays in technical setups. After yesterday's bruising 8.89% decline to $199.88, the stock finds itself at an intriguing inflection point. However, the real story might still be several percentage points away.
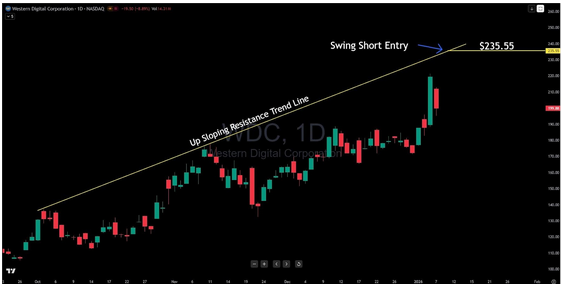
Let's rewind the tape. WDC carved out an impressive rally from October's $110-115 lows, nearly doubling as it climbed through the fall. But that ascent wasn't random—it's been consistently capped by an upsloping resistance trendline that's rejected price advances twice already, once in October and again in November near the $220-225 zone. That November rejection was particularly telling, as buyers pushed hard only to see sellers slam the door shut.
Which brings us to the current setup, and this is where experienced traders start paying attention. That same ascending resistance line now projects to $235.55, and here's what makes this level fascinating: it would represent the third test of this ceiling. In technical analysis, third touches of trendlines carry special significance. They often mark the point where a pattern either breaks decisively or holds with conviction. It's like a pitcher who's gotten the same batter out twice; that third at-bat tells you everything about who's really in control.
But WDC would need to rally roughly 18% from yesterday's close just to reach that $235.55 swing short entry zone. Yesterday's sharp selloff suggests the bulls have work to do before that becomes relevant. The stock needs to stabilize, base, and build enough momentum to make another run at overhead resistance.
For traders eyeing the bearish side, the strategy crystallizes around that potential third rejection. If WDC can mount a recovery rally back toward $235.55 and then falters at the trendline again, that sets up a high-probability short entry with clearly defined risk. The reward? A 15-20% decline would send shares back to the $187.50 area, where previous pivot highs established support—a measured move that aligns with the stock's recent volatility patterns.
The risk management is straightforward: any daily close above $235.55 and through that resistance trendline invalidates the bearish thesis entirely. At that point, WDC would likely be breaking into new swing high territory, and shorts would need to step aside quickly.
What makes this setup particularly instructive is its requirement for patience. The opportunity doesn't exist yet—price needs to recover first. That's the hallmark of disciplined swing trading: identifying the level where edge appears, then waiting for the market to deliver price to that zone. Rush the entry from current levels, and you're guessing rather than trading probabilities.
So where does WDC go from here? The immediate question is whether buyers can stabilize things after yesterday's flush or if further weakness materializes. But for those watching the bigger picture, the narrative revolves around that $235.55 level. Can the stock recover enough to test resistance a third time? And if it does, will that ascending trendline hold once again, or will bulls finally punch through after two prior rejections?
The chart suggests sellers have had the upper hand at this trendline. Whether that pattern persists at the next test (assuming we get one) will tell us plenty about WDC's true directional intentions for the weeks ahead.
Author

Benjamin Pool
Verified Investing
A seasoned financial expert with a passion for empowering individuals to mastering smart money management.


