Walt Disney (DIS) Stock News and Forecast: Why is Disney stock down?
- Disney stock reported earnings on Wednesday after the market closed.
- DIS missed on EPS and also on revenue.
- Disney saw subscriber growth in streaming, but that growth has slowed.

Disney (DIS) stock slid in the aftermarket on Wednesday as the company released its Q4 earnings. At the time of writing the stock is down nearly 5% in Thursday's premarket.
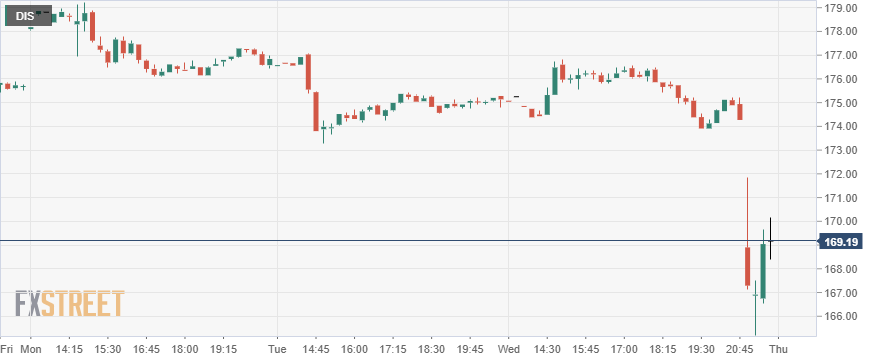
Disney (DIS) stock chart, 15-minute
Disney (DIS) stock news
Disney's earnings were mixed. Earnings per share missed estimates, coming in at $0.37 versus the $0.44 estimate. Revenue however also missed estimates at $18.53 billion versus the $18.79 billion estimate. Disney+ reported that paid subscribers increased from 73.7 million last year to 118.1 million this year. During the Disney earnings conference call, the company confirmed guidance to reach 230-260 million subscribers by 2024. Recently Disney has reduced the price of its streaming service Disney+ to $1.99 in order to combat slowing subscriber growth. According to FactSet, Disney+ added 2.1 million customers versus the estimate for 10.2 million. Disney also spoke about the possibility of alternative businesses, such as moving into the metaverse with the CEO saying the company has always been an "early adopter" of technology. He added, "We'll be able to connect the physical and digital worlds..allowing for storytelling without boundaries in our own Disney metaverse."
Cowen & Co. are out this morning with a reduced price target for DIS stock, cutting from $147 to $137.
The DIS quote is currently at $165.93 in Thursday's premarket, down 4.9%.
Disney (DIS) stock forecast
The situation looks perilous as the big support line in place since summer has finally given way. The more a support line or resistance for that matter is tested, the weaker it becomes each time. This break is a strong signal. DIS shares had already given up the 200-day moving average and now enter a huge volume vacuum. Look at the volume profile bars on the right of our Disney graph below – no volume until $130 means that things could get ugly.
The stochastic has already given its sell signal, and the Moving Average Convergence Divergence (MACD) is sure to follow today. Disney has broken out of a huge sidewways range, and a breakout can lead to strong trends. In this case, that looks to be a bearish one. There is a gap to fill down to $157 and another one at $128. Only at under $130 would we reexamine long opportunities.
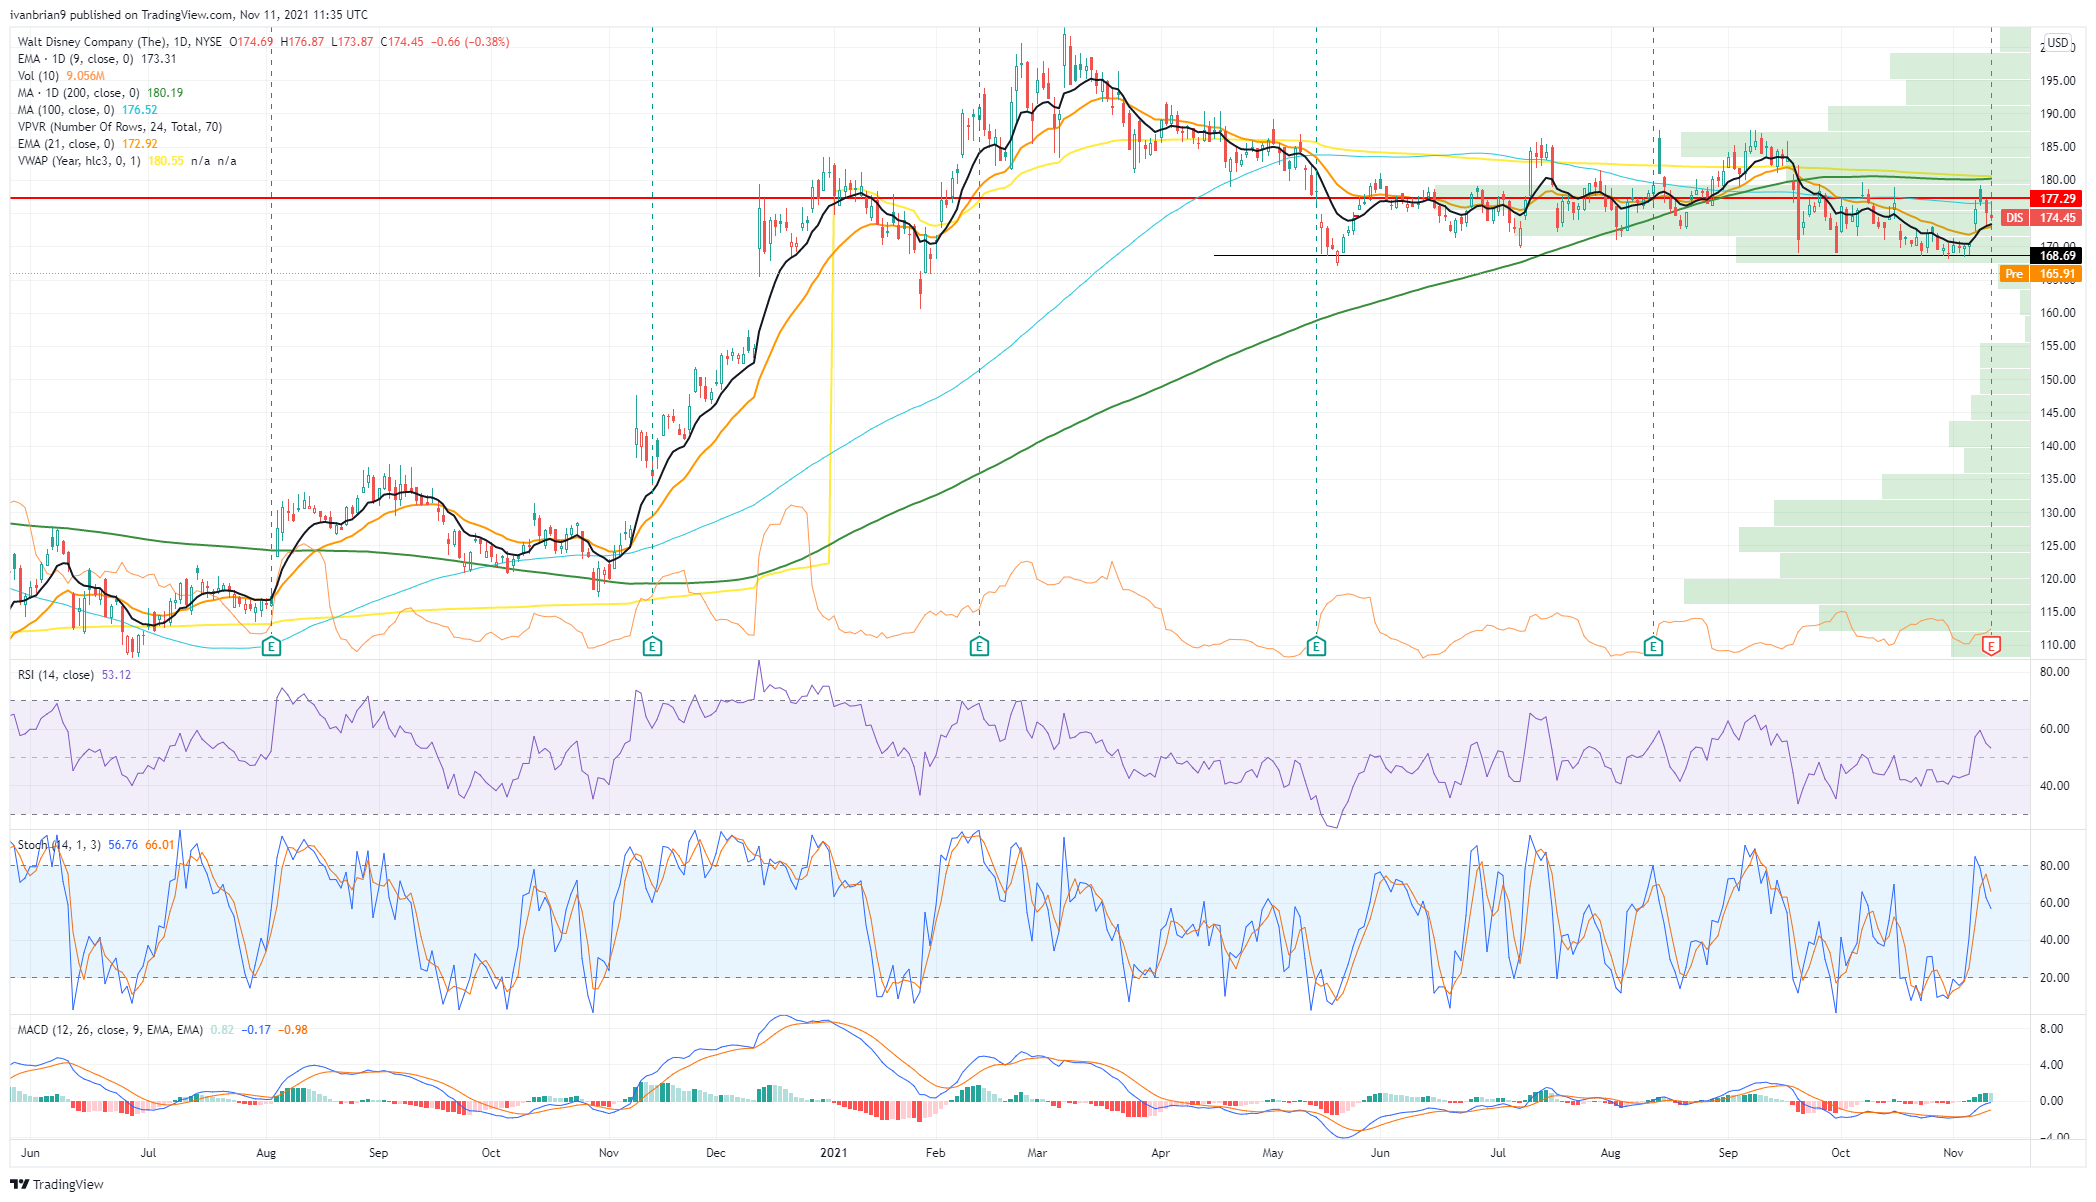
DIS 1-day chart
Premium
You have reached your limit of 3 free articles for this month.
Start your subscription and get access to all our original articles.
Author

Ivan Brian
FXStreet
Ivan Brian started his career with AIB Bank in corporate finance and then worked for seven years at Baxter. He started as a macro analyst before becoming Head of Research and then CFO.


