Visa Inc. (V) Elliott Wave technical analysis [Video]
![Visa Inc. (V) Elliott Wave technical analysis [Video]](https://editorial.fxstreet.com/images/Macroeconomics/EconomicIndicator/ConsumerSpending/Consumption/paying-by-credit-card-gm171555949-21665159_XtraLarge.jpg)
V Elliott Wave Analysis Trading Lounge.
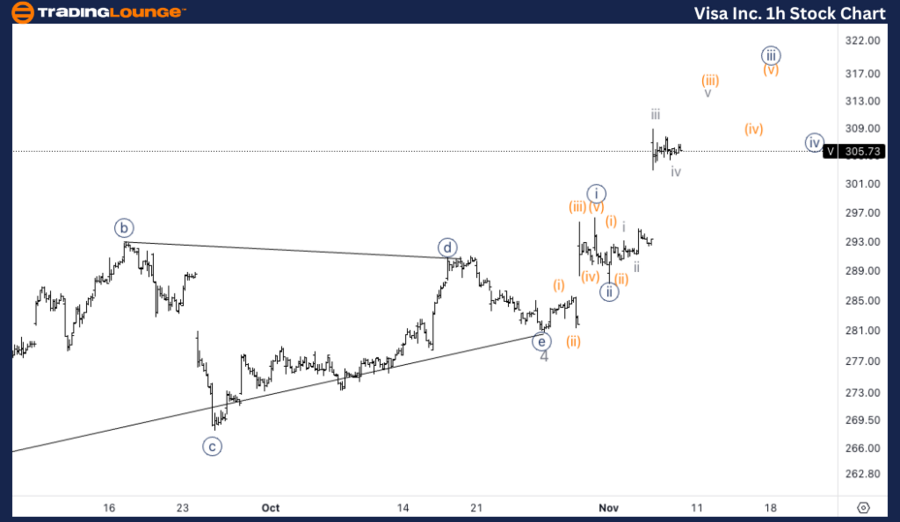
Visa Inc., (V) Daily Chart.
V Elliott Wave technical analysis
Function: Trend.
Mdoe: Impulsive.
Structure: Motive.
Position: Wave 5 of (1).
Direction: Upside in wave 5.
Details: Looking for continuation within wave (1) as we have just broken above TradingLevel3 at 300$, we could expect resistance within MinorGroup1, especially around 320$.
Visa Inc., (V) 1H Chart
V Elliott Wave technical analysis
Function: Trend.
Mode: Impulsive.
Structure: Motive.
Position: Wave {iii} of 5.
Direction: Upside in (iii) of {iii}.
Details: The gaps to the upside seems to be agreeing with the assumption we are in a wave (iii) of {iii}. Looking for a series of pullbacks as we enter MG1 of 300$.
This analysis of Visa Inc., (V) focuses on both the daily and 1-hour charts, using the Elliott Wave Theory to assess current market trends and forecast future price movements.
V Elliott Wave technical analysis – Daily chart
The daily chart shows that Visa is progressing in wave 5 of an impulsive move within wave (1). After breaking above the significant resistance at TradingLevel 3 ($300), there is potential for continued upside, though resistance could be encountered around MinorGroup1 (MG1), particularly near $320. This region may slow the advance temporarily as the market consolidates gains. However, the overall outlook remains bullish with the expectation that wave 5 will continue pushing higher as wave (1) unfolds.
V Elliott Wave technical analysis – One-hour chart
The 1-hour chart suggests that Visa is in the middle of a strong upward move within wave (iii) of {iii} of wave 5. The recent gaps to the upside support the assumption of a powerful impulsive rally. As the stock moves into MinorGroup1 (MG1) near $300, traders should watch for potential pullbacks or consolidation phases. These minor corrections within the broader uptrend could provide buying opportunities, especially as the bullish momentum in wave (iii) of {iii}continues to drive the price higher.
Technical analyst: Alessio Barretta.
V Elliott Wave technical analysis [Video]
Author

Peter Mathers
TradingLounge
Peter Mathers started actively trading in 1982. He began his career at Hoei and Shoin, a Japanese futures trading company.


