|

USD/THB Price Analysis: Buyers hold sway, bearish turn spotlighted as bullish momentum slows

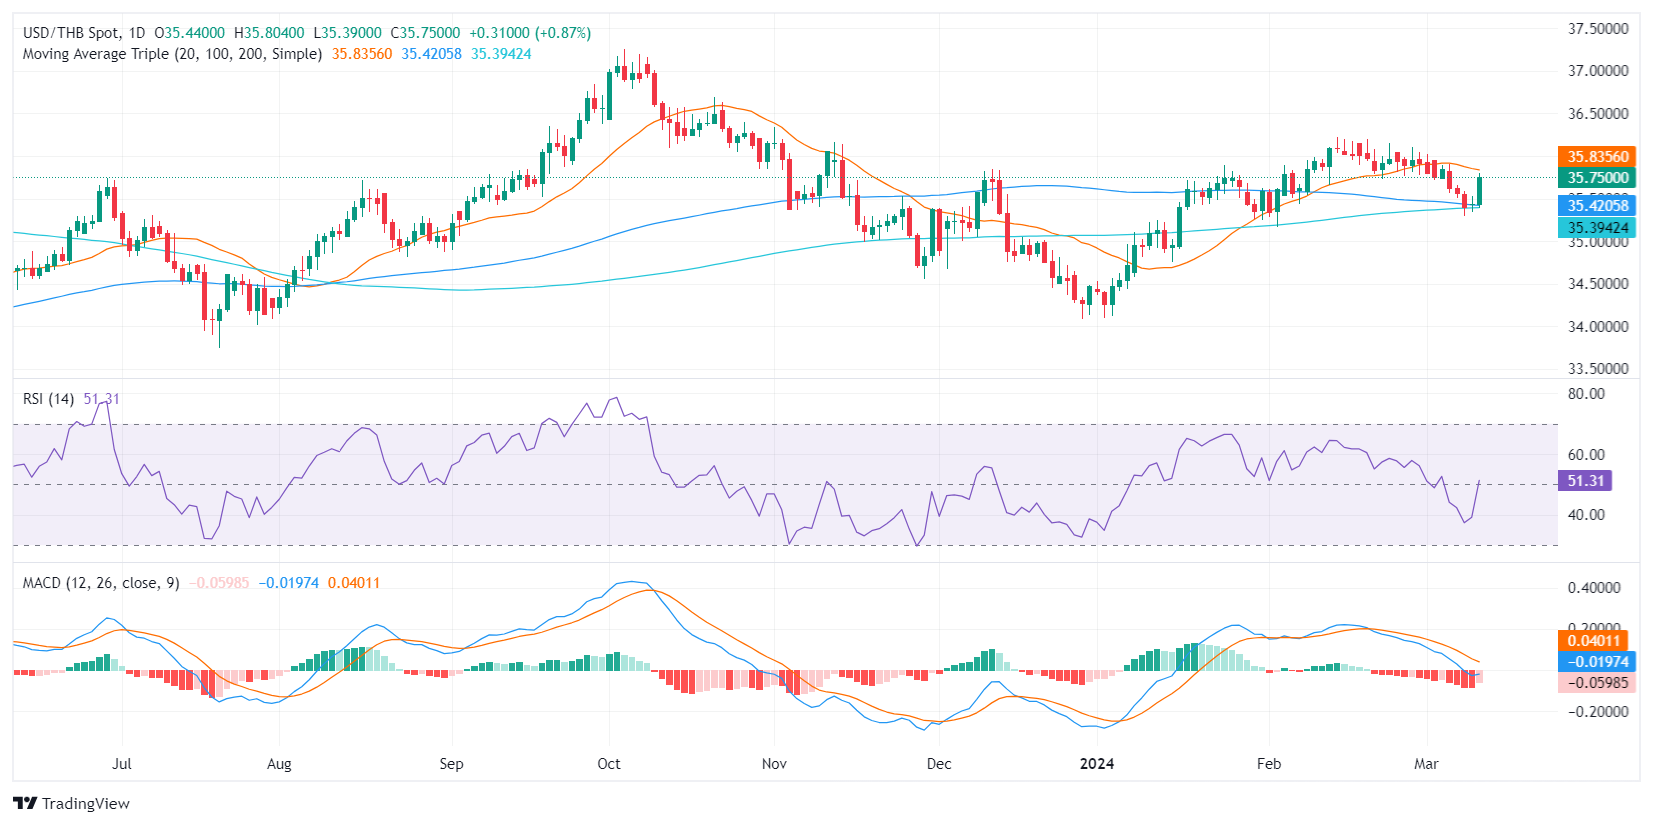
  • The RSI on the daily chart remains largely positive, suggesting an increase in buying momentum.
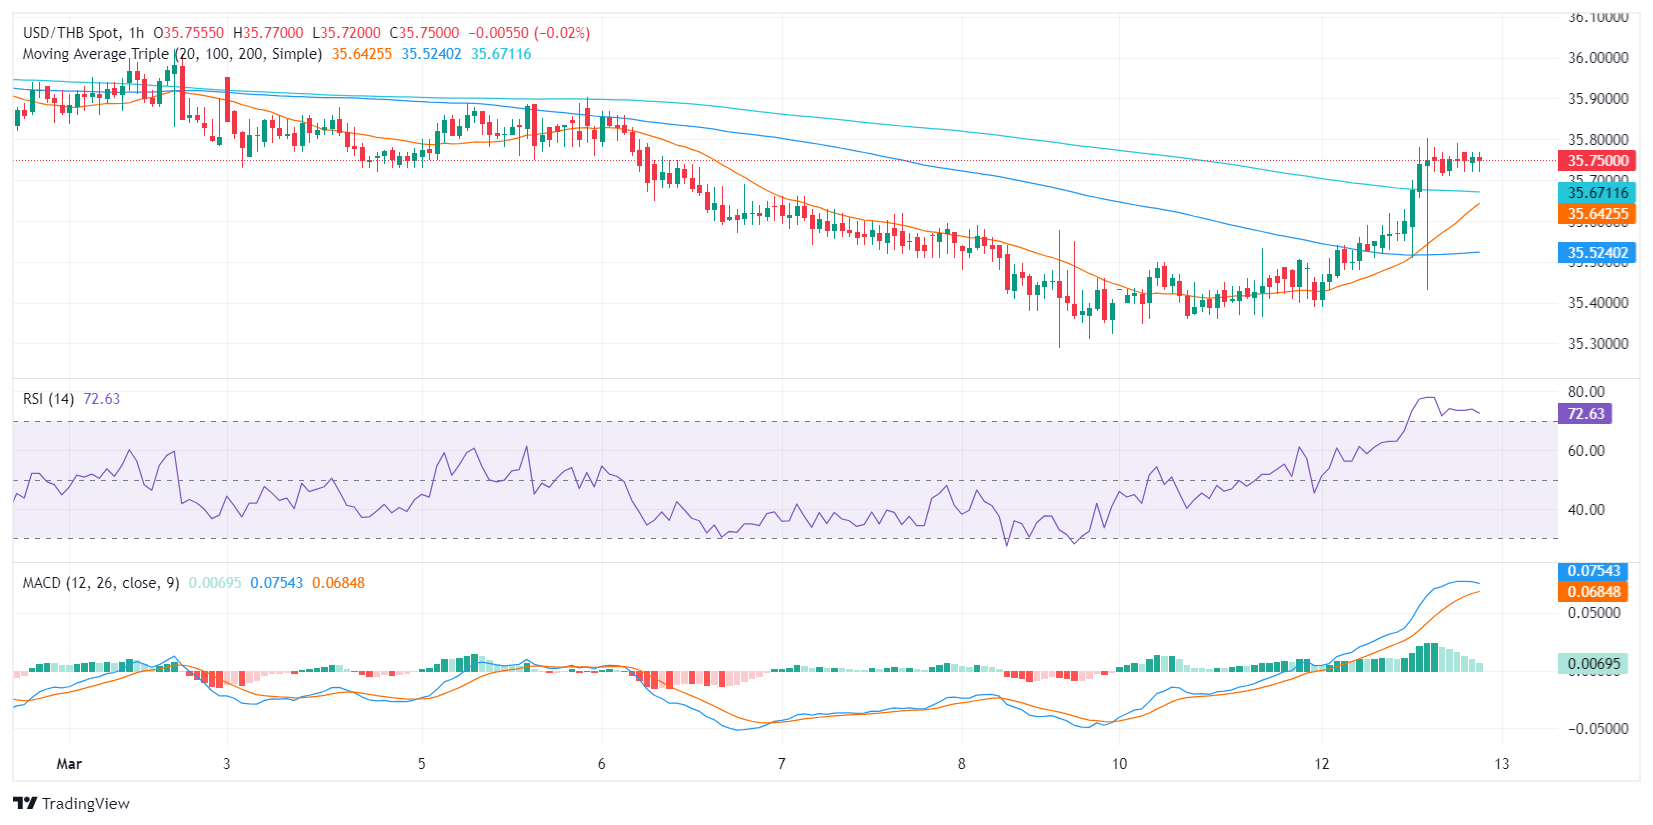
  • On the hourly chart, the RSI in overbought territory hints at intense buying traction which could lead to a correction.
  • The pair continues to operate above the main SMAs, indicating a long-term bullish sentiment.

The USD/THB pair is currently trading at a level of 35.74, up by 0.91% on Tuesday. The daily chart points to growing bullish momentum, while hourly indicators reached overbought conditions, which could push the pair into a consolidation phase in the next hours.

On the daily chart, the USD/THB pair shows the Relative Strength Index (RSI) jumped above 50 on Tuesday suggesting that the bulls are recovering. However, this positive outlook is tempered by the red bars of the Moving Average Convergence Divergence (MACD) histogram, which despite being shorter, point out that there are still signs of selling momentum.

USD/THB daily chart

Switching to the hourly chart, the RSI has surged into overbought territory, indicating that buyers are taking a strong foothold in the shorter-term market dynamics. However, the MACD histogram displays decreasing green bars, implying a loss of bullish momentum as well. Though the buying pressure was strong, it appears to be losing steam quickly as buyers might consolidate gains in the next hours.

USD/THB hourly chart

In conclusion, buyers seem to dominate, keeping the USD/THB pair above the 100 and 200-day Simple Moving Averages (SMAs) on the daily chart. In contrast, the hourly chart suggests the bullish momentum may be fading.

Author

Patricio Martín

Patricio is an economist from Argentina passionate about global finance and understanding the daily movements of the markets.

More from Patricio Martín
Share:

Editor's Picks

EUR/USD eyes nine-day EMA barrier after rebounding from 1.1600

EUR/USD gains ground after registering modest losses in the previous session, trading around 1.1620 during the Asian hours on Friday. The technical analysis of the daily chart suggests an ongoing bearish bias as the pair remains within the descending channel pattern.

GBP/USD: Pound Sterling ticks up against US Dollar in countdown to US NFP

The Pound Sterling trades marginally higher to near 1.3365 against the US Dollar during the Asian trading session on Friday. The GBP/USD pair edges up as the US Dollar ticks down ahead of the United States Nonfarm Payrolls data for February, which will be published at 13:30 GMT.

Gold awaits US Nonfarm Payrolls for a clear directional impetus

Gold rebounds above $5,100 early Friday after testing the $5,050 level amid global sell-off. The US Dollar pulls back as profit-taking creeps in ahead of US labor data. For February. 21-day SMA holds amid bullish RSI; a daily closing above 61.8% Fibo is critical for Gold buyers.

Ethereum pull in $169M as validators pile in to stake ETH

US spot Ethereum exchange-traded funds recorded $169 million in net inflows on Wednesday, marking the largest daily intake in two months, according to SoSoValue data. The rise in inflows signals renewed institutional interest in Ethereum amid broader market volatility.

The market compass is pointing at a barrel of Oil

The Asian open is arriving with equities leaning the wrong way, and the reason is not complicated. The market’s compass needle has snapped firmly toward crude. In this tape, oil is not just another input price; it is the gravitational center around which every asset class is orbiting.

Ripple tests recovery strength amid steady ETF inflows, growing retail interest

Ripple (XRP) continues to demonstrate notable resilience as the cryptocurrency market navigates the persistent war in the Middle East after the United States (US) and Israel attacked Iran on Saturday.