|

USD/MXN Price Analysis: Climbs from weekly lows, eyeing $19.00

  • USD/MXN recovers some ground after dropping to weekly lows of 18.8231.
  • Despite the ongoing upward correction, the USD/MXN is still downward biased.
  • USD/MXN: Failure to crack 19.0000 could exacerbate a retest of the YTD lows of 18.50.

The Mexican peso (MXN) is losing ground against the US Dollar (USD) after recovering some ground on Tuesday, following “dovish” perceived remarks by the  US Federal Reserve (Fed) Chair Jerome Powell. The USD/MXN dropped from around 19.1783 towards the week’s lows at 18.8691, but on Wednesday, the buck is recovering. At the time of writing, the USD/MXN exchanges hands at 18.9475, above its opening price by 0.17%.

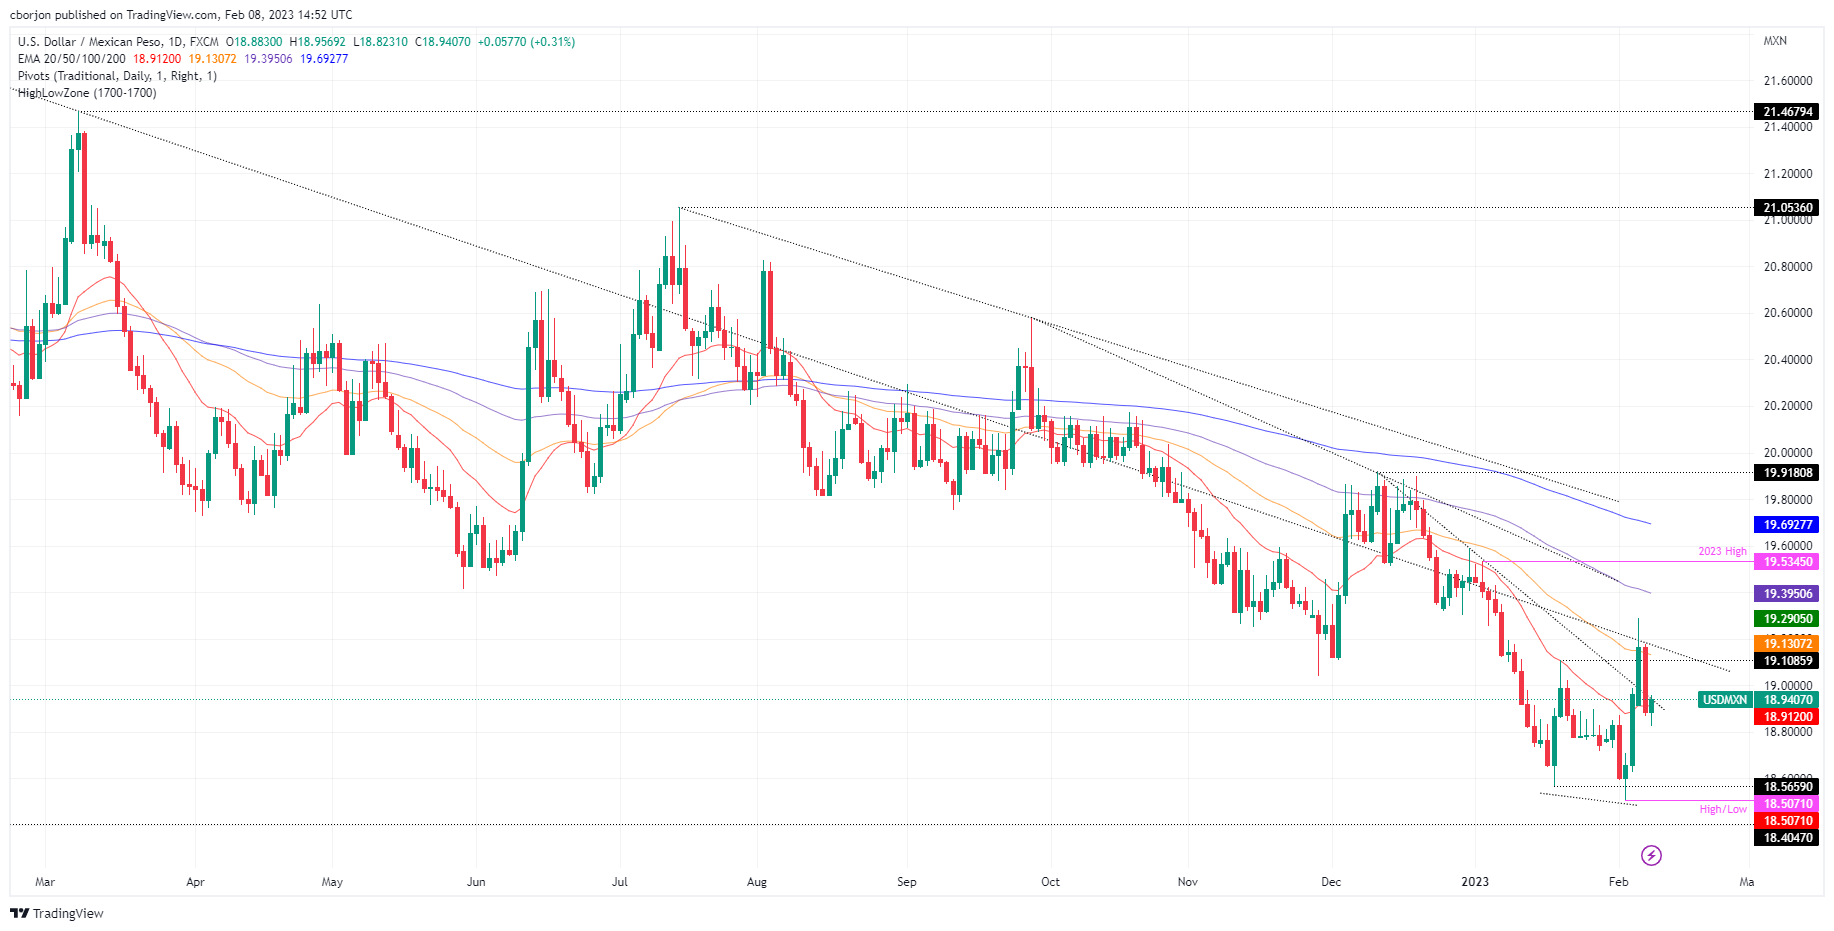
USD/MXN Price Analysis: Technical outlook

Before Wall Street opened, the USD/MXN pair was trading at around the day’s lows, around 18.8231. However, a risk-off impulse increased demand for the US Dollar, so the USD/MXN is moving upwards.

The USD/MXN daily chart suggests further downside is expected, but the ongoing correction could open the door for further gains. At the time of typing, the USD/MXN has broken the 20-day Exponential Moving Average (EMA) at $18.9134 and could extend its gains towards 19.0000, a psychological resistance. A breach of the latter and the USD/MXN could rally toward January 19 daily high at 19.1085.

For the resumption of the downtrend, the USD/MXN needs a break below the 20-day EMA at 18.9134. Once cleared, that would expose critical support levels. Firstly, the February 7 low of 18.8691, followed by the day’s low at 18.8231, and then the YTD low at 18.50

USD/MXN Key Technical Levels

USD/MXN

Overview
Today last price18.9069
Today Daily Change0.0169
Today Daily Change %0.09
Today daily open18.89
 
Trends
Daily SMA2018.8312
Daily SMA5019.238
Daily SMA10019.5137
Daily SMA20019.8253
 
Levels
Previous Daily High19.1794
Previous Daily Low18.872
Previous Weekly High18.9885
Previous Weekly Low18.5082
Previous Monthly High19.5361
Previous Monthly Low18.5663
Daily Fibonacci 38.2%18.9894
Daily Fibonacci 61.8%19.062
Daily Pivot Point S118.7816
Daily Pivot Point S218.6731
Daily Pivot Point S318.4741
Daily Pivot Point R119.089
Daily Pivot Point R219.2879
Daily Pivot Point R319.3964

Author

Christian Borjon Valencia

Christian Borjon began his career as a retail trader in 2010, mainly focused on technical analysis and strategies around it. He started as a swing trader, as he used to work in another industry unrelated to the financial markets.

More from Christian Borjon Valencia
Share:

Markets move fast. We move first.

Orange Juice Newsletter brings you expert driven insights - not headlines. Every day on your inbox.

By subscribing you agree to our Terms and conditions.

Editor's Picks

EUR/USD gathers recovery momentum, trades near 1.1750

Following the correction seen in the second half of the previous week, EUR/USD gathers bullish momentum and trades in positive territory near 1.1750. The US Dollar (USD) struggles to attract buyers and supports the pair as investors await Tuesday's GDP data ahead of the Christmas holiday. 

GBP/USD rises toward 1.3450 on renewed USD weakness

GBP/USD turns north on Monday and avances to the 1.3450 region. The US Dollar (USD) stays on the back foot to begin the new week as investors adjust their positions before tomorrow's third-quarter growth data, helping the pair stretch higher.

Gold not done with record highs

Gold extends its rally in the American session on Monday and trades at a new all-time-high above $4,420, gaining nearly 2% on a daily basis. The potential for a re-escalation of the tensions in the Middle East on news of Israel planning to attack Iran allows Gold to capitalize on safe-haven flows.

Top 10 crypto predictions for 2026: Institutional demand and big banks could lift Bitcoin

Bitcoin could hit record highs in 2026, according to Grayscale and top crypto asset managers. Institutional demand and digital-asset treasury companies set to catalyze gains in Bitcoin.

Ten questions that matter going into 2026

2026 may be less about a neat “base case” and more about a regime shift—the market can reprice what matters most (growth, inflation, fiscal, geopolitics, concentration). The biggest trap is false comfort: the same trades can look defensive… right up until they become crowded.

XRP steadies above $1.90 support as fund inflows and retail demand rise

Ripple (XRP) is stable above support at $1.90 at the time of writing on Monday, after several attempts to break above the $2.00 hurdle failed to materialize last week. Meanwhile, institutional interest in the cross-border remittance token has remained steady.