|

USD/MXN Price Analysis: Bears have the upper hand near 200-hour SMA/61.8% Fibo. confluence

  • USD/MXN is seen consolidating in a narrow trading band through the early European session.
  • The technical setup favours bearish traders and supports prospects for a retest of the YTD low.
  • A move back above the 23.6% Fibo. level is needed to negate the near-term bearish outlook.

The USD/MXN pair lacks any firm intraday direction on Thursday and oscillates in a narrow trading band, below the 16.85 level through the early European session.

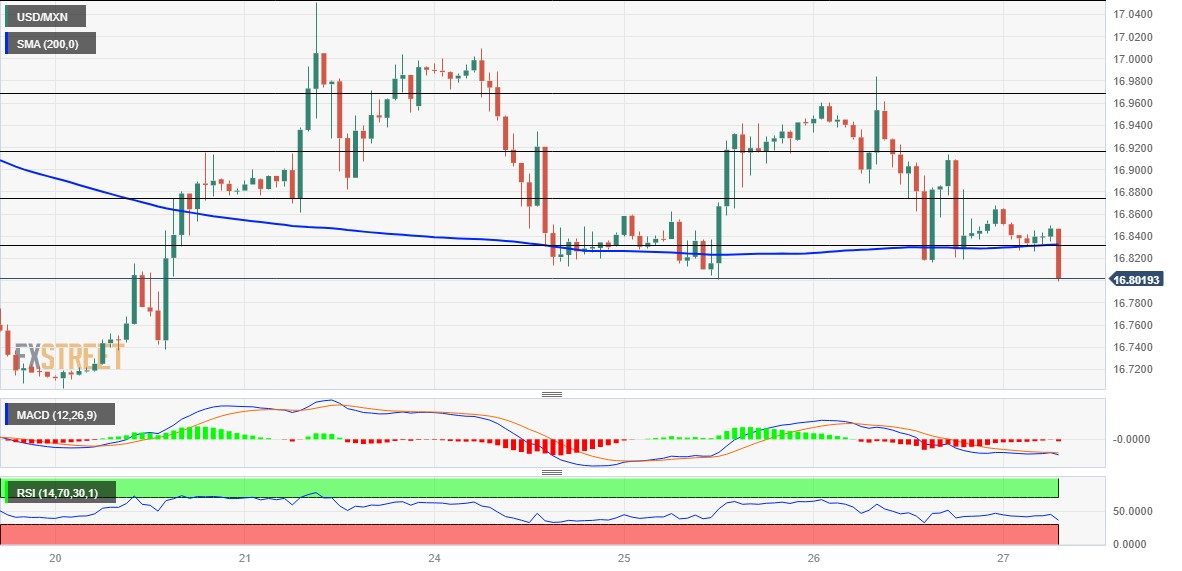
From a technical perspective, spot prices currently hover around the confluence comprising of the 200-hour Simple Moving Average (SMA) and the 61.8% Fibonacci retracement level of the recent modest recovery from the lowest level since December 2015. Some follow-through selling below the overnight swing low, around the 16.80 area, will be seen as a fresh trigger for bearish traders and pave the way for a further near-term depreciating move.

Meanwhile, oscillators on the daily chart - though have been recovering - are still holding in the bearish territory and have again started gaining negative traction on hourly charts. This, in turn, suggests that the path of least resistance for the USD/MXN pair is to the downside. Hence, a subsequent slide back towards challenging the multi-year low, around the 16.70 region touched last week, looks like a distinct possibility.

Sustained weakness below the latter will be seen as a fresh trigger for bearish traders and expose the next relevant support near the 16.60 region. The USD/MXN pair could extend the downward trajectory and eventually drop to October/November 2015 lows, around the 16.3555-16.3250 area.

On the flip side, the 50% Fibo. level, around the 16.8740-16.8745 region now seems to act as an immediate strong barrier. A sustained strength beyond might trigger a short-covering move towards the 16.9200 zone en route to the 16.9600-16.9700 supply zone. The latter coincides with the 23.6% Fibo. level, which if cleared decisively will negate the negative outlook and lift the USD/MXN back above the 17.00 mark.

USD/MXN 1-hour chart

fxsoriginal

Key levels to watch

USD/MXN

Overview
Today last price16.8104
Today Daily Change-0.0324
Today Daily Change %-0.19
Today daily open16.8428
 
Trends
Daily SMA2016.9508
Daily SMA5017.2302
Daily SMA10017.6831
Daily SMA20018.4188
 
Levels
Previous Daily High16.9837
Previous Daily Low16.8166
Previous Weekly High17.0512
Previous Weekly Low16.6924
Previous Monthly High17.7286
Previous Monthly Low17.0243
Daily Fibonacci 38.2%16.8804
Daily Fibonacci 61.8%16.9199
Daily Pivot Point S116.7783
Daily Pivot Point S216.7139
Daily Pivot Point S316.6112
Daily Pivot Point R116.9455
Daily Pivot Point R217.0482
Daily Pivot Point R317.1126

Author

Haresh Menghani

Haresh Menghani is a detail-oriented professional with 10+ years of extensive experience in analysing the global financial markets.

More from Haresh Menghani
Share:

Markets move fast. We move first.

Orange Juice Newsletter brings you expert driven insights - not headlines. Every day on your inbox.

By subscribing you agree to our Terms and conditions.

Editor's Picks

EUR/USD moves sideways below 1.1800 on Christmas Eve

EUR/USD struggles to find direction and trades in a narrow channel below 1.1800 after posting gains for two consecutive days. Bond and stock markets in the US will open at the usual time and close early on Christmas Eve, allowing the trading action to remain subdued. 

GBP/USD keeps range around 1.3500 amid quiet markets

GBP/USD keeps its range trade intact at around 1.3500 on Wednesday. The Pound Sterling holds the upper hand over the US Dollar amid pre-Christmas light trading as traders move to the sidelines heading into the holiday season. 

Gold retreats from record highs, trades below $4,500

Gold retreats after setting a new record-high above $4,520 earlier in the day and trades in a tight range below $4,500 as trading volumes thin out ahead of the Christmas break. The US Dollar selling bias remains unabated on the back of dovish Fed expectations, which continues to act as a tailwind for the bullion amid persistent geopolitical risks.

Bitcoin slips below $87,000 as ETF outflows intensify, whale participation declines

Bitcoin price continues to trade around $86,770 on Wednesday, after failing to break above the $90,000 resistance. US-listed spot ETFs record an outflow of $188.64 million on Tuesday, marking the fourth consecutive day of withdrawals.

Economic outlook 2026-2027 in advanced countries: Solidity test

After a year marked by global economic resilience and ending on a note of optimism, 2026 looks promising and could be a year of solid economic performance. In our baseline scenario, we expect most of the supportive factors at work in 2025 to continue to play a role in 2026.

Avalanche struggles near $12 as Grayscale files updated form for ETF

Avalanche trades close to $12 by press time on Wednesday, extending the nearly 2% drop from the previous day. Grayscale filed an updated form to convert its Avalanche-focused Trust into an ETF with the US Securities and Exchange Commission.