|

USD/MXN exchange rate leaps on Mexico’s inflation cools down, weak US data

  • USD/MXN sees strong gains on cooling inflation data from Mexico.
  • Weaker PMI and ADP figures suggest potential challenges for the US labor market and economic growth.
  • USD/MXN Price Analysis: A daily close above the 20-day EMA could lead to a rally towards the 100-day EMA at 18.8382.

The Mexican Peso (MXN) depreciated vs. the US Dollar (USD) as market sentiment shifted sour. A raft of economic data from the United States (US) and Mexico spurred a jump in the exchange rate. At the time of writing, the USD/MXN is trading at 18.3469

USD/MXN climbs as Mexico’s inflation cools down

Wall Street is trading mixed, with the S&P 500 and the Nasdaq posting losses while the Dow Jones climb. The USD/MXN is registering solid gains on data from Mexico, showing that inflation is cooling down. Data from INEGI showed that inflation rose by 6.85% YoY, below estimates of 6.90%, as revealed by a Reuters poll. Core inflation, which excludes volatile items, cooled from 8.09% to 8.09% annually.

Last week, Banxico (the Mexican central bank) raised rates by 25 bps moderating the pace of tightening. Analysts expect Banxico to keep rates unchanged at around 11.25%,

On the US front, the ISM Non-Manufacturing PMI dropped to 51.2, which is lower than the anticipated 54.4 and falls short of the previous month’s reading of 55.1. The decline is attributed to a decrease in new orders growth and less robust business activity. Meanwhile, February ADP figures showed private hiring increased by 145K, below the expected 200K, trailing January’s upwardly revised figure of 261K.

Given the latest round of labor market metrics pointing to deterioration, a jump in Initial Jobless Claims for the latest week could open the door for a weaker US Nonfarm Payrolls figure. Analysts predict that the number of payrolls for March will be around 240K, which is lower than February’s figure of 311K.

USD/MXN Technical analysis

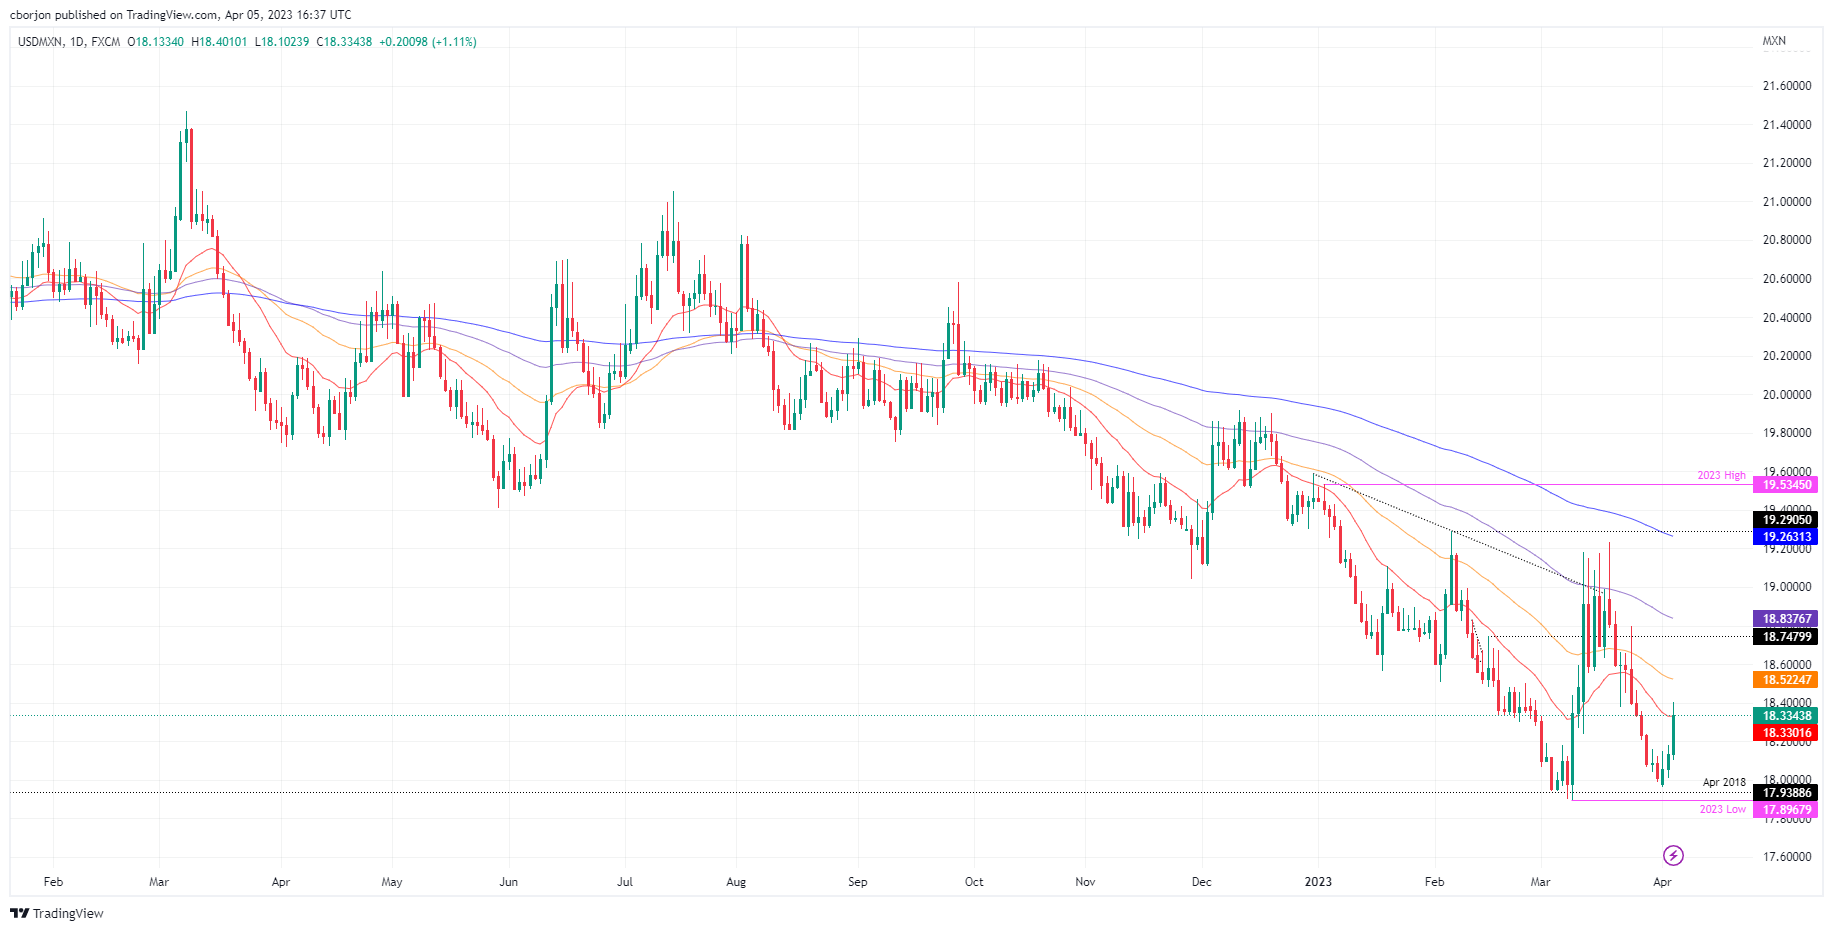
The USD/MXN appears to have bottomed at around 18.0000. USD/MXN weekly gains above 2% spurred a rise from 17.9644 toward 18.4000, exposing the 20-day Exponential Moving Average (EMA) at 18.3329. A daily close above the latter could exacerbate a rally towards the 100-day EMA At 18.8382, but firstly, buyers need to clear the 50-day EMA At 18.5235. On the other hand, a dip below the 20-day EMA and the USD/MXN could re-test 18.0000.

USD/MXN

Overview
Today last price18.3516
Today Daily Change0.2150
Today Daily Change %1.19
Today daily open18.1366
 
Trends
Daily SMA2018.4477
Daily SMA5018.5023
Daily SMA10018.9254
Daily SMA20019.5126
 
Levels
Previous Daily High18.1821
Previous Daily Low18.0122
Previous Weekly High18.4681
Previous Weekly Low17.99
Previous Monthly High19.2324
Previous Monthly Low17.8977
Daily Fibonacci 38.2%18.1172
Daily Fibonacci 61.8%18.0771
Daily Pivot Point S118.0385
Daily Pivot Point S217.9404
Daily Pivot Point S317.8687
Daily Pivot Point R118.2084
Daily Pivot Point R218.2802
Daily Pivot Point R318.3783

Author

Christian Borjon Valencia

Christian Borjon began his career as a retail trader in 2010, mainly focused on technical analysis and strategies around it. He started as a swing trader, as he used to work in another industry unrelated to the financial markets.

More from Christian Borjon Valencia
Share:

Markets move fast. We move first.

Orange Juice Newsletter brings you expert driven insights - not headlines. Every day on your inbox.

By subscribing you agree to our Terms and conditions.

Editor's Picks

EUR/USD tests nine-day EMA support near 1.1750

EUR/USD loses ground for the fourth consecutive session, trading around 1.1760 during the Asian hours on Monday. On the daily chart, technical analysis indicates a weakening bullish bias, as the pair tests to break below the lower boundary of the ascending channel pattern.

GBP/USD softens below 1.3500 but retains positive technical outlook

The GBP/USD pair loses momentum near 1.3485 during the early European session on Monday, pressured by renewed US Dollar demand. The potential downside for a major pair might be limited, as the Bank of England guided that monetary policy will remain on a gradual downward path.

Gold pulls back from record high as profit-taking sets in

Gold price retreats from a record high near $4,550 during the early European trading hours on Monday as traders book some profits ahead of holidays. A renewed US Dollar could also weigh on the precious metal, as it makes Gold more expensive for non-US buyers, pressuring prices.

Bitcoin, Ethereum, and XRP bulls regain strength

Bitcoin, Ethereum, and Ripple record roughly 3% gains on Monday, regaining strength mid-holiday season. Despite thin liquidity in the holiday season, BTC and major altcoins are regaining strength as US President Donald Trump pushes peace talks between Russia and Ukraine. The technical outlook for Bitcoin, Ethereum, and Ripple gradually shifts bullish as selling pressure wanes.

Economic outlook 2026-2027 in advanced countries: Solidity test

After a year marked by global economic resilience and ending on a note of optimism, 2026 looks promising and could be a year of solid economic performance. In our baseline scenario, we expect most of the supportive factors at work in 2025 to continue to play a role in 2026.

Avalanche struggles near $12 as Grayscale files updated form for ETF

Avalanche trades close to $12 by press time on Wednesday, extending the nearly 2% drop from the previous day. Grayscale filed an updated form to convert its Avalanche-focused Trust into an ETF with the US Securities and Exchange Commission.