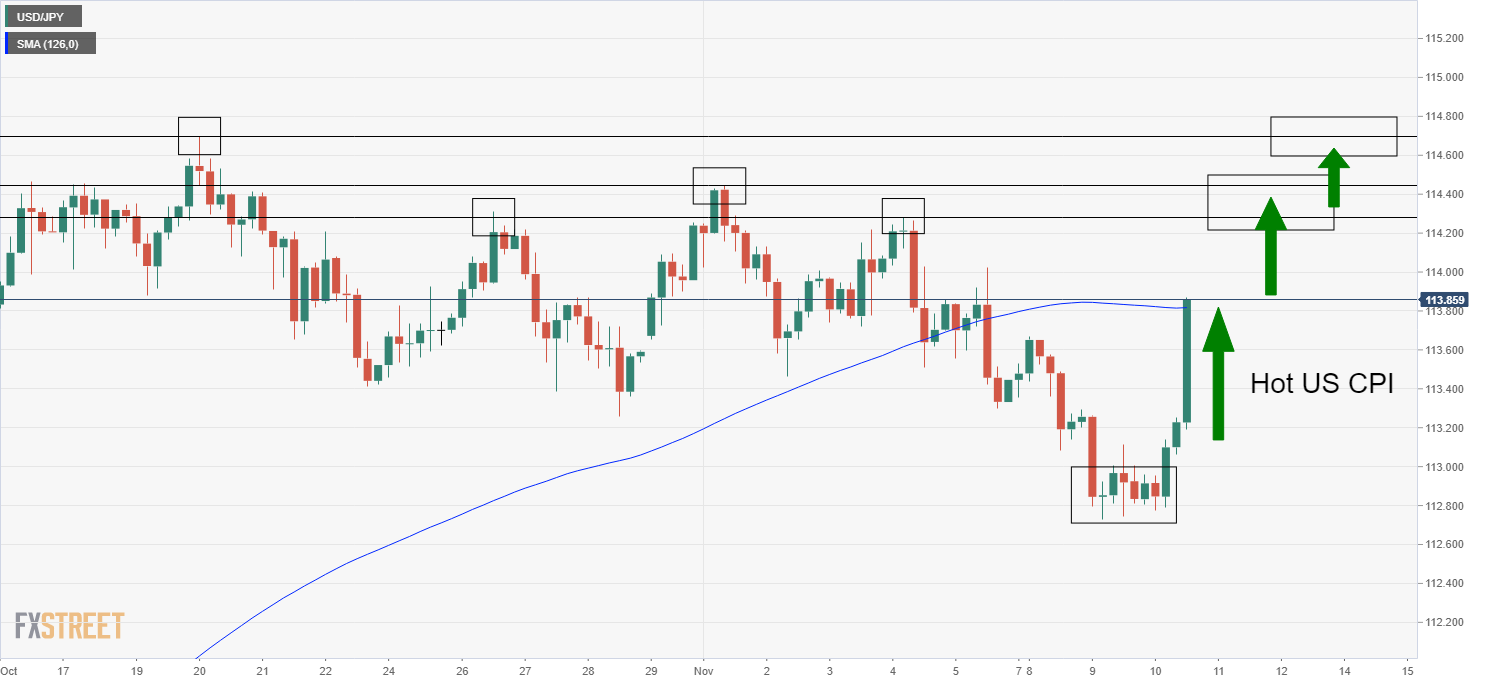
USD/JPY up sharply to test 21DMA at 113.80, as hot US inflation piles pressure on Fed
- USD/JPY has rallied sharply from Asia session lows under 113.00 and is testing its 21DMA at 113.80.
- A spike in US yields post-inflation data is widening US/Japan rate differentials and pushing the pair higher.

USD/JPY continues to recover from its earlier weekly lows under the 113.00 level and is now – in wake of a much hotter than expected US Consumer Price Inflation report – testing its 21-day moving average at 113.80. This means the pair is now trading about 0.8% higher on the day, its best one-day performance in a month.
The move is primarily being driven by a sharp rally in (nominal) US bond yields as traders up their bets that the Fed will take a more aggressive line on hiking rates to combat inflation, and as investors flee assets whose value is eroded by inflation (such as nominal bonds). 2-year yields are up 9bps to 0.50% and 5-year yields are up more than 10bps on the day to above 1.17%. That compares to a rally of just over 1bps in the 30-year yield. US yield curve flattening traders are betting on a combination of higher inflation/a more hawkish Fed response in the medium term (i.e. over the next up to five years), but are not significantly upgrading their long-term growth or inflation expectations.
Either way, higher yields and expectations for a more forceful Fed response to inflation has given US/Japan rate differentials a sizeable boost. USD/JPY is highly sensitive to rate differentials and is thus rallying as a result. As pressure builds on the Fed to drop its current stance that the spike in inflation is transitory, and thus doesn’t warrant a policy response, traders should lookout for any signs that the bank might shift policy in a hawkish direction. Any hints of this would send short-end US yields even higher, put further upwards pressure on US/Japan rate differentials, and likely push USD/JPY back to annual highs.
If USD/JPY is able to break to the north of its 21DMA, this will open the door to a run at the 114.00 level and the recent highs just above it in the 114.20-114.40 region. Bullish technicians may be targetting an eventual move back to annual highs just above 114.60.
Author

Joel Frank
Independent Analyst
Joel Frank is an economics graduate from the University of Birmingham and has worked as a full-time financial market analyst since 2018, specialising in the coverage of how developments in the global economy impact financial asset


