USD/JPY Technical Analysis: Sideways pattern emerging as market sentiment remains key driver
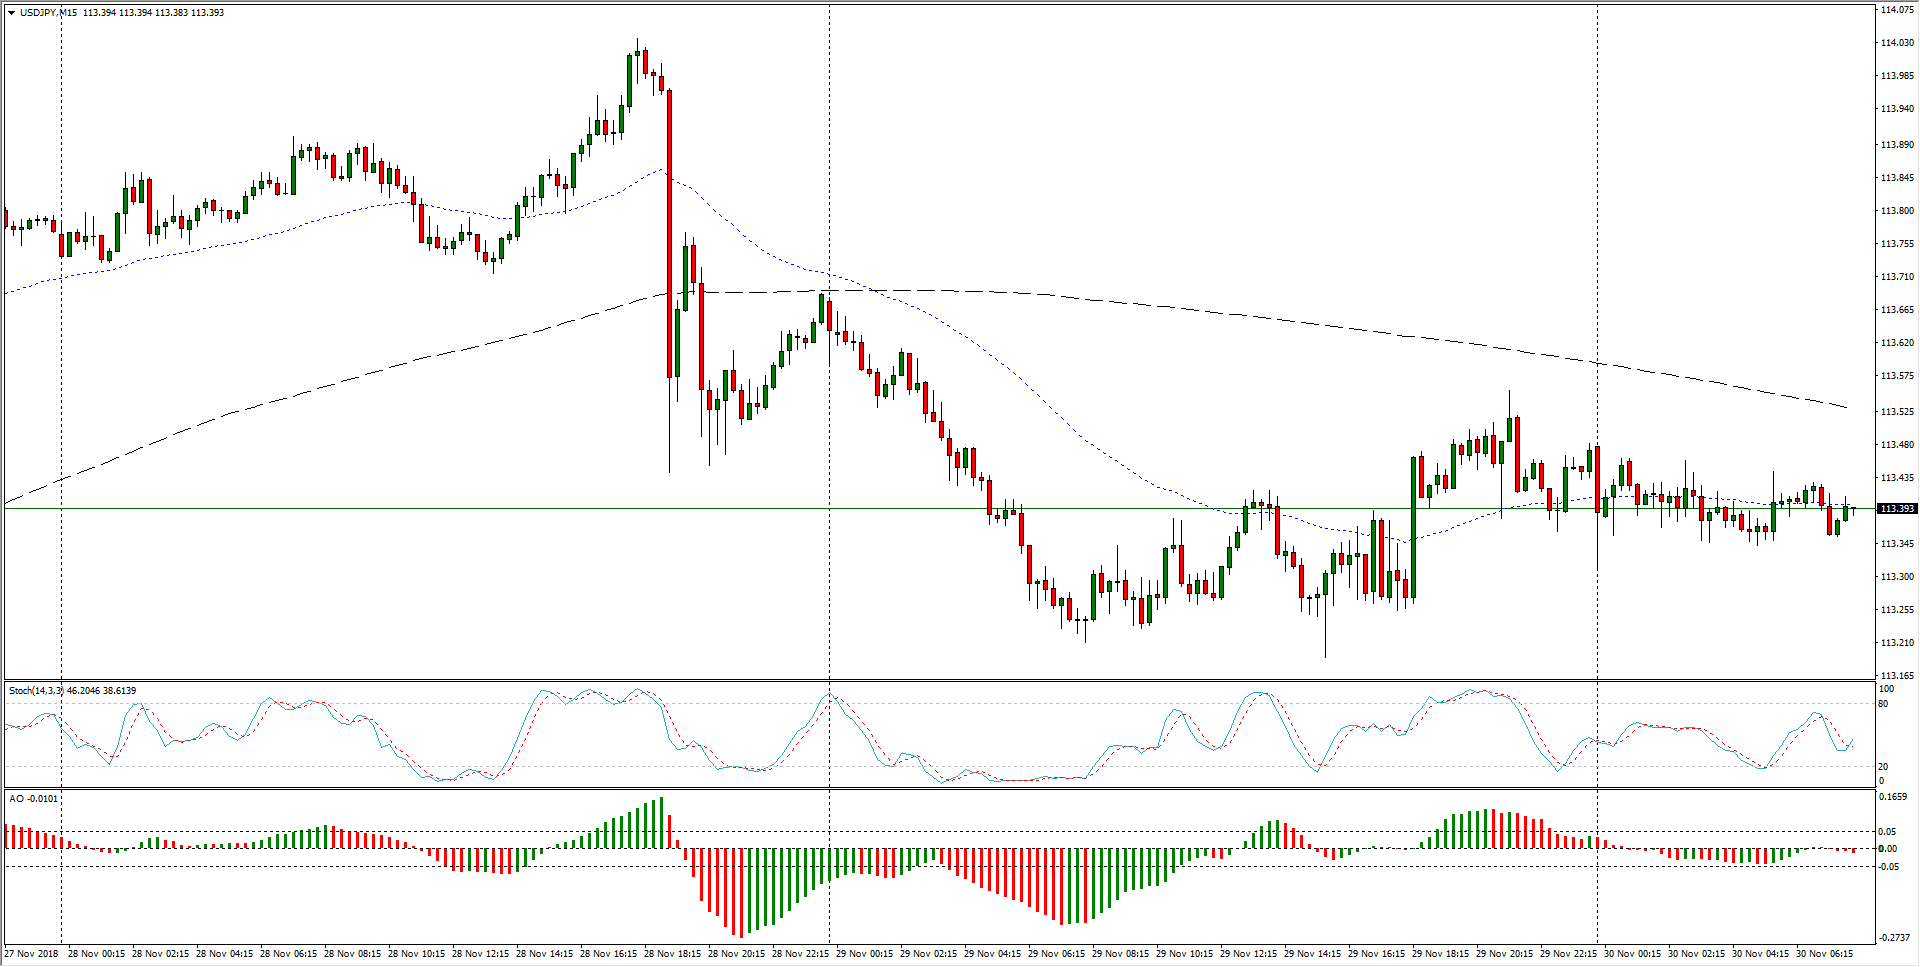
- USD/JPY remains tight with 1113.40 through Friday's early session, stuck in a tight range within Thursday's high/low spread.

USD/JPY, 15-Minute
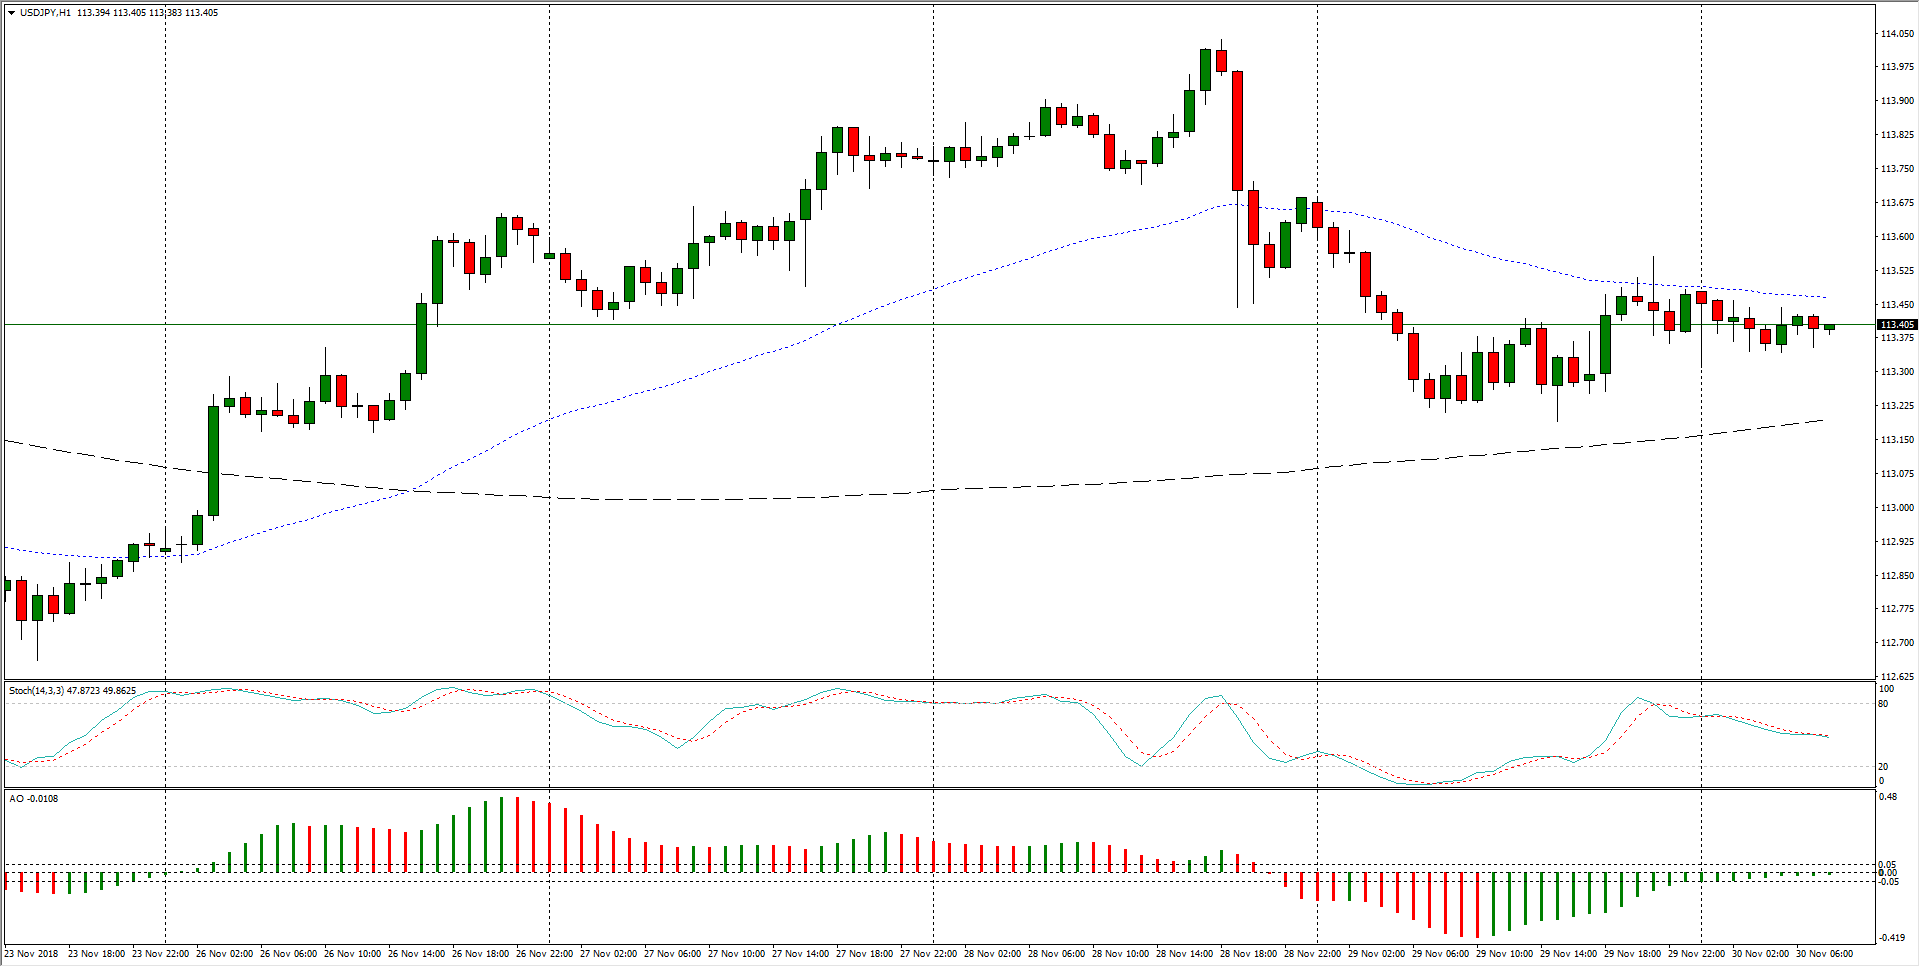
- Hourly candles show the pair caught in a non-directional zone, constrained within the 50-hour and 200-hour moving averages as the pair goes trendless in the near-term.
USD/JPY, 1-Hour
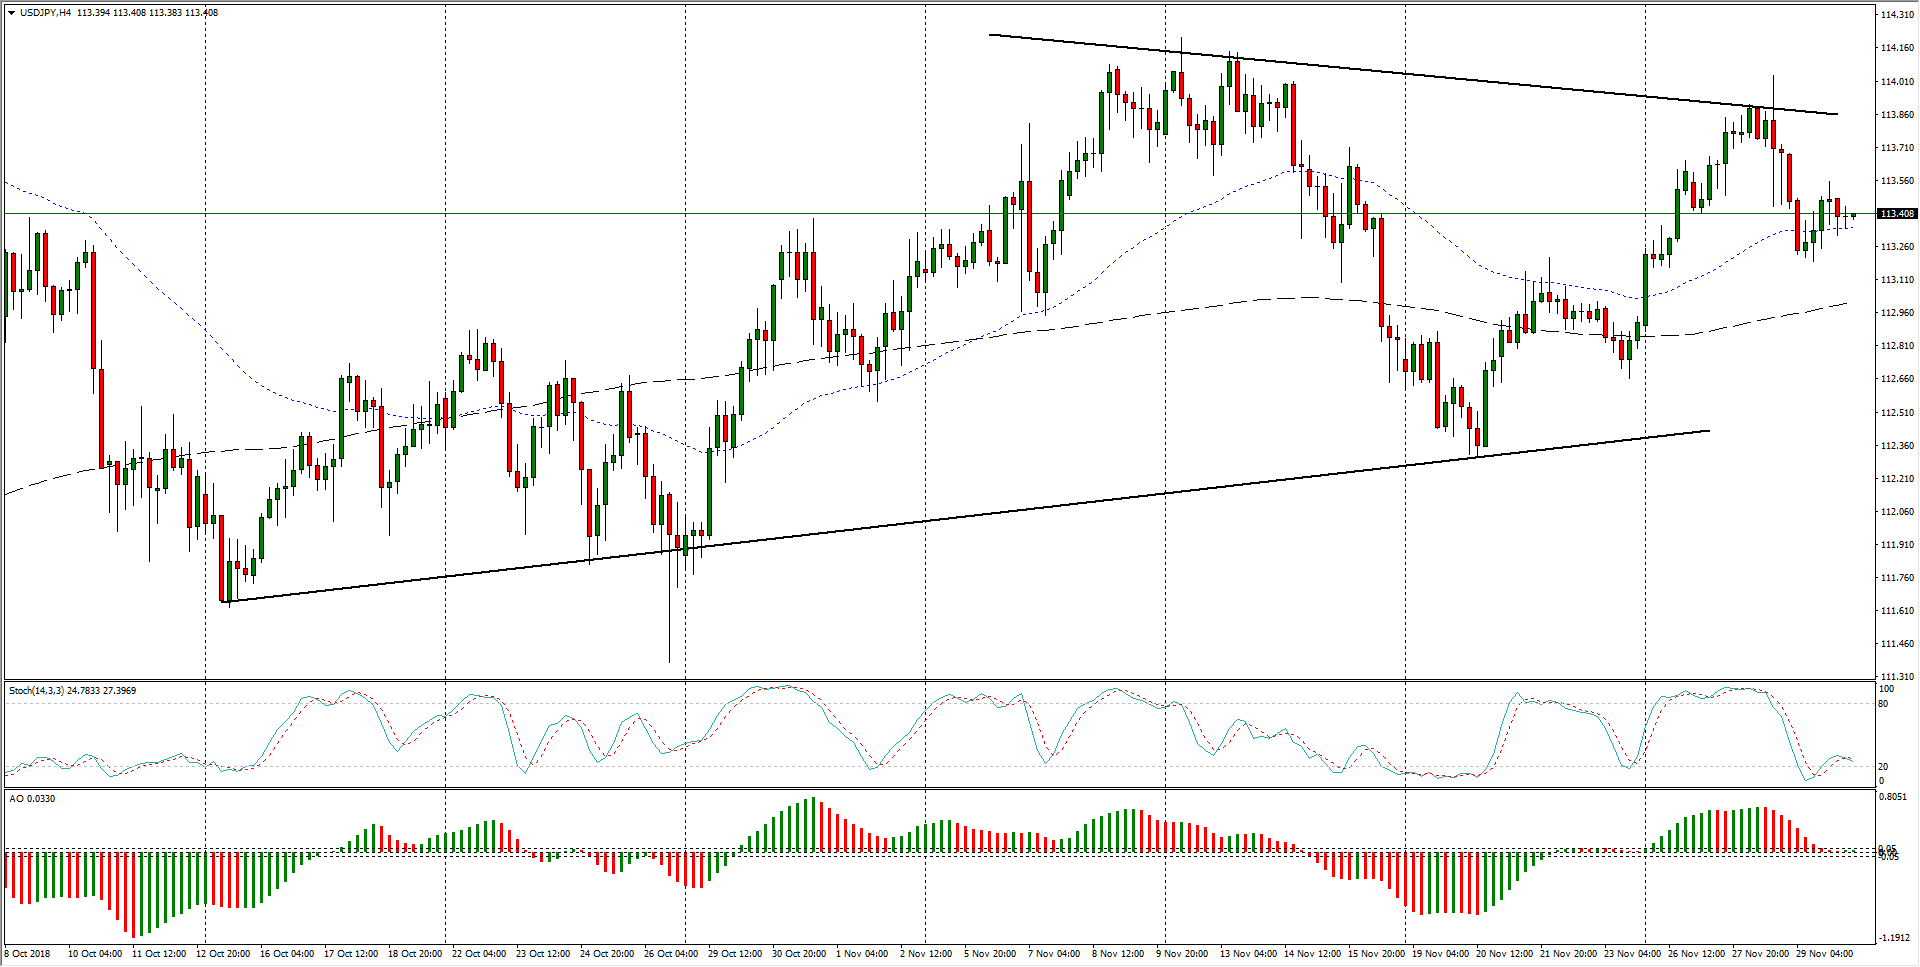
- USD/JPY has been slowly tightening for two months, caught between higher lows and slightly lower highs from 114.00 to 112.50, and the challenge for markets will be to successfully establish a break-and-retest of either direction before setting off on a new trend.
USD/JPY, 4-Hour
USD/JPY
Overview:
Today Last Price: 113.38
Today Daily change: -1.0 pips
Today Daily change %: -0.00882%
Today Daily Open: 113.39
Trends:
Previous Daily SMA20: 113.36
Previous Daily SMA50: 113.05
Previous Daily SMA100: 112.22
Previous Daily SMA200: 110.4
Levels:
Previous Daily High: 113.69
Previous Daily Low: 113.18
Previous Weekly High: 113.24
Previous Weekly Low: 112.3
Previous Monthly High: 114.56
Previous Monthly Low: 111.38
Previous Daily Fibonacci 38.2%: 113.37
Previous Daily Fibonacci 61.8%: 113.5
Previous Daily Pivot Point S1: 113.15
Previous Daily Pivot Point S2: 112.91
Previous Daily Pivot Point S3: 112.64
Previous Daily Pivot Point R1: 113.66
Previous Daily Pivot Point R2: 113.93
Previous Daily Pivot Point R3: 114.17
Author

Joshua Gibson
FXStreet
Joshua joins the FXStreet team as an Economics and Finance double major from Vancouver Island University with twelve years' experience as an independent trader focusing on technical analysis.


