USD/JPY recovers back over 144.00 after a rebound from steep Thursday declines
- The Yen went on a tear on Thursday, climbing over 4% against the US Dollar.
- Markets have pared back over-eager Yen bids fueled by a potential end of BoJ negative rates.
- US NFP Friday still looms over broader markets, high-impact data to close out the week.

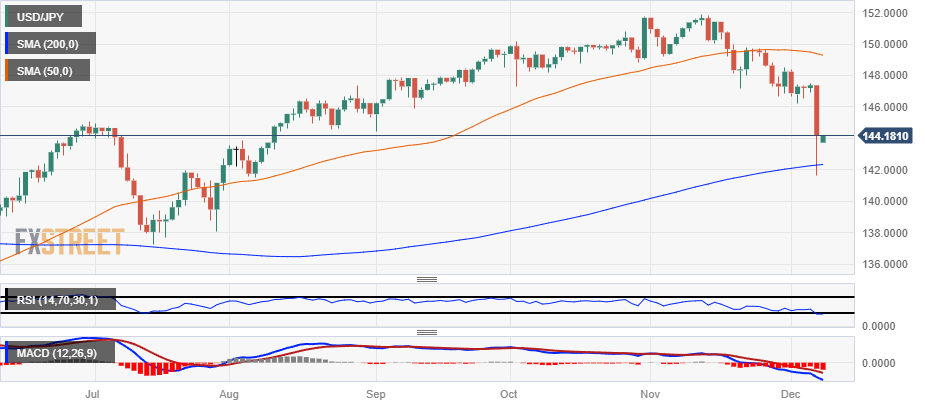
The USD/JPY plunged over 4% on Thursday, briefly declining below 142.00 before broader markets staged a moderate rebound, pulling the Japanese Yen (JPY) back into reasonable gain territory. The USD/JPY finished Thursday down around 2%, with the Yen heading into Friday’s market session deep in the green for the week.
The Yen saw a broad-market rally sparked by uncharacteristically hawkish comments from Bank of Japan (BoJ) Governor Kazuo Ueda, who unexpectedly began hinting at an eventual end of the BoJ’s negative rate regime, potentially early next year.
Hawkish BoJ sends Yen bets through the roof on Thursday
Japan’s Core Consumer Price Index (CPI) inflation hit 2.9% in October, and Japanese inflation has spent 19 consecutive months overshooting the BoJ’s 2% inflation target. The BoJ has avoided tightening policy because the Japanese central bank currently expects inflation to slump below 2% sometime in 2025.
With Japanese wages expected to see outsized gains next year as employers step up pay increases to combat rising prices, the BoJ appears prepared to begin discussing a reversal of its long-running negative rate policy mechanism, which has seen a slight cost associated with holding Japanese debt for the past seven years.
Especially overeager money markets are currently pricing in a 20% chance of a BoJ rate increase at the Japanese central bank’s upcoming policy meeting on December 18 & 19. The BoJ’s next quarterly growth and interest rate review is slated for the end of January.
Japanese Yen price today
The table below shows the percentage change of Japanese Yen (JPY) against listed major currencies today. Japanese Yen was the strongest against the Swiss Franc.
| USD | EUR | GBP | CAD | AUD | JPY | NZD | CHF | |
| USD | -0.27% | -0.25% | 0.01% | -0.71% | -2.06% | -0.48% | 0.09% | |
| EUR | 0.26% | -0.03% | 0.28% | -0.45% | -1.80% | -0.22% | 0.32% | |
| GBP | 0.28% | -0.01% | 0.29% | -0.44% | -1.80% | -0.20% | 0.35% | |
| CAD | -0.04% | -0.28% | -0.27% | -0.73% | -2.09% | -0.49% | 0.07% | |
| AUD | 0.71% | 0.45% | 0.44% | 0.72% | -1.35% | 0.22% | 0.79% | |
| JPY | 1.99% | 1.80% | 1.76% | 2.03% | 1.30% | 1.56% | 2.10% | |
| NZD | 0.47% | 0.22% | 0.21% | 0.51% | -0.28% | -1.58% | 0.54% | |
| CHF | -0.09% | -0.35% | -0.40% | -0.08% | -0.84% | -2.15% | -0.59% |
The heat map shows percentage changes of major currencies against each other. The base currency is picked from the left column, while the quote currency is picked from the top row. For example, if you pick the Euro from the left column and move along the horizontal line to the Japanese Yen, the percentage change displayed in the box will represent EUR (base)/JPY (quote).
USD/JPY Technical Outlook
The USD/JPY pinned into four-month lows on Thursday, plunging over 4% peak-to-trough before ending the day at a comparatively reasonable -2%, hitting four-month lows below 142.00 before recovering to close out the day just above 144.00.
Despite the intraday recovery, the USD/JPY saw one of its worst-performing days in over a year, when the pair fell below the 140.00 handle last November.
Over the course of Thursday’s trading the USD/JPY went from softly bearish to collapsing into the 200-day Simple Moving Average, and a bullish rebound will need to make significant headway before recovering the 147.00 handle. The 50-day SMA is rotating into a bearish stance well above Thursday’s price action, pushing down into the 1149.00 region.
USD/JPY Hourly Chart

USD/JPY Daily Chart
USD/JPY Technical Levels
Author

Joshua Gibson
FXStreet
Joshua joins the FXStreet team as an Economics and Finance double major from Vancouver Island University with twelve years' experience as an independent trader focusing on technical analysis.

















