USD/JPY Price Forecast: Remains sideways below 162.00 despite Japan intervention fears
- USD/JPY wobbles near 161.80 while investors remain sidelined amid Japan intervention fears.
- Investors await a slew of US data this week, especially the Nonfarm Payrolls data for June.
- The Fed is seen as certain to deliver at least one interest rate hike this year.

The USD/JPY pair trades in a tight range around 161.80 during the European trading session on Monday. The pair struggles for a direction while market experts remain confident of Tokyo’s intervention to support the Japanese Yen (JPY).
Officials from Japan have warned several times that the ministry remains vigilant to one-sided excessive moves against the domestic currency.
Meanwhile, the US Dollar (USD) trades marginally lower, with investors shifting focus to the United States (US) Nonfarm Payrolls (NFP) data for June, which will be released on Thursday. At press time, the US Dollar Index (DXY), which tracks the Greenback’s value against six major currencies, trades 0.16% lower to near 101.20.
Investors will pay close attention to the US NFP data to get fresh cues regarding the Federal Reserve’s (Fed) monetary policy outlook. According to the CME FedWatch tool, the odds of the Fed delivering at least one interest rate hike this year are almost 90%.
Before the US NFP data, investors will focus on the US ISM Manufacturing PMI and ADP Employment data for June and the JOLTS Job Openings data for May.
USD/JPY technical analysis
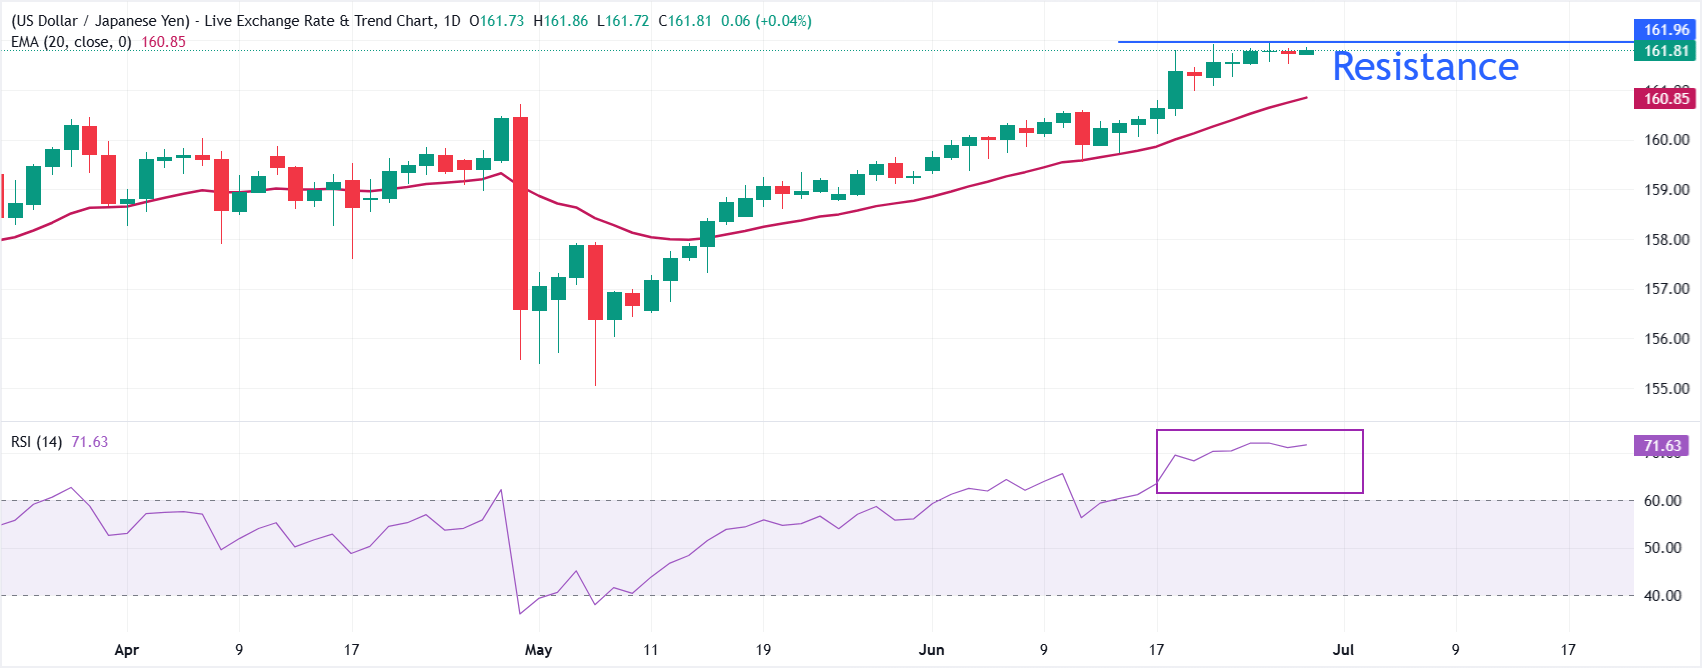
USD/JPY trades flat at around 161.80, extending its advance well above the 20-day exponential moving average (EMA) at 160.85, which reinforces a bullish near-term bias while that floor holds.
The Relative Strength Index (RSI) at 71.61 is in overbought territory, hinting that upside momentum is strong but increasingly vulnerable to a corrective pause rather than a fresh acceleration.
On the downside, initial support is located at the 20-day EMA around 160.85, where a pullback could find buyers on the first test. A sustained break below this moving average would weaken the constructive tone and open the door to a deeper retracement. Looking up, the pair needs to break decisively above 162.00 for further downside towards 163.00 and 164.00.
(The technical analysis of this story was written with the help of an AI tool.)
Japanese Yen FAQs
The Japanese Yen (JPY) is one of the world’s most traded currencies. Its value is broadly determined by the performance of the Japanese economy, but more specifically by the Bank of Japan’s policy, the differential between Japanese and US bond yields, or risk sentiment among traders, among other factors.
One of the Bank of Japan’s mandates is currency control, so its moves are key for the Yen. The BoJ has directly intervened in currency markets sometimes, generally to lower the value of the Yen, although it refrains from doing it often due to political concerns of its main trading partners. The BoJ ultra-loose monetary policy between 2013 and 2024 caused the Yen to depreciate against its main currency peers due to an increasing policy divergence between the Bank of Japan and other main central banks. More recently, the gradually unwinding of this ultra-loose policy has given some support to the Yen.
Over the last decade, the BoJ’s stance of sticking to ultra-loose monetary policy has led to a widening policy divergence with other central banks, particularly with the US Federal Reserve. This supported a widening of the differential between the 10-year US and Japanese bonds, which favored the US Dollar against the Japanese Yen. The BoJ decision in 2024 to gradually abandon the ultra-loose policy, coupled with interest-rate cuts in other major central banks, is narrowing this differential.
The Japanese Yen is often seen as a safe-haven investment. This means that in times of market stress, investors are more likely to put their money in the Japanese currency due to its supposed reliability and stability. Turbulent times are likely to strengthen the Yen’s value against other currencies seen as more risky to invest in.
Author

Sagar Dua
FXStreet
Sagar Dua is associated with the financial markets from his college days. Along with pursuing post-graduation in Commerce in 2014, he started his markets training with chart analysis.