USD/JPY Price Forecast: Pair consolidates below key moving averages
- The Japanese Yen holds firm on hawkish BoJ signals and intervention concerns.
- USD/JPY trades above the 50-day SMA but remains capped by the 200-day and 100-day SMAs.
- Buyers need to clear the 158.53-160.00 region to strengthen the recovery.


USD/JPY trades in a narrow range on Wednesday, with the Japanese Yen (JPY) holding a slight advantage over the US Dollar (USD) as traders assess hawkish Bank of Japan (BoJ) signals. Intervention risks near the 160.00 level also keep traders cautious. At the time of writing, the pair trades around 158, little changed on the day.
New BoJ policymaker Ayano Sato backed raising interest rates in several stages, reinforcing expectations that the central bank will continue gradually normalising policy after lifting its rate to 1.25% in September. Speaking on Tuesday, BoJ Governor Kazuo Ueda said, “We’re to keep raising rates in response to the economy and inflation.” However, he added that the “pace and timing of future policy adjustment will be decided based on the likelihood of our baseline projections materialising, as well as risks.”
However, broad US Dollar strength leaves the Yen vulnerable, while concerns over Japan’s fiscal outlook, elevated Oil prices and relatively low interest rates remain additional headwinds. Surging US Treasury yields are also widening the yield gap between the United States and Japan, further limiting demand for the Yen.
Technical Analysis
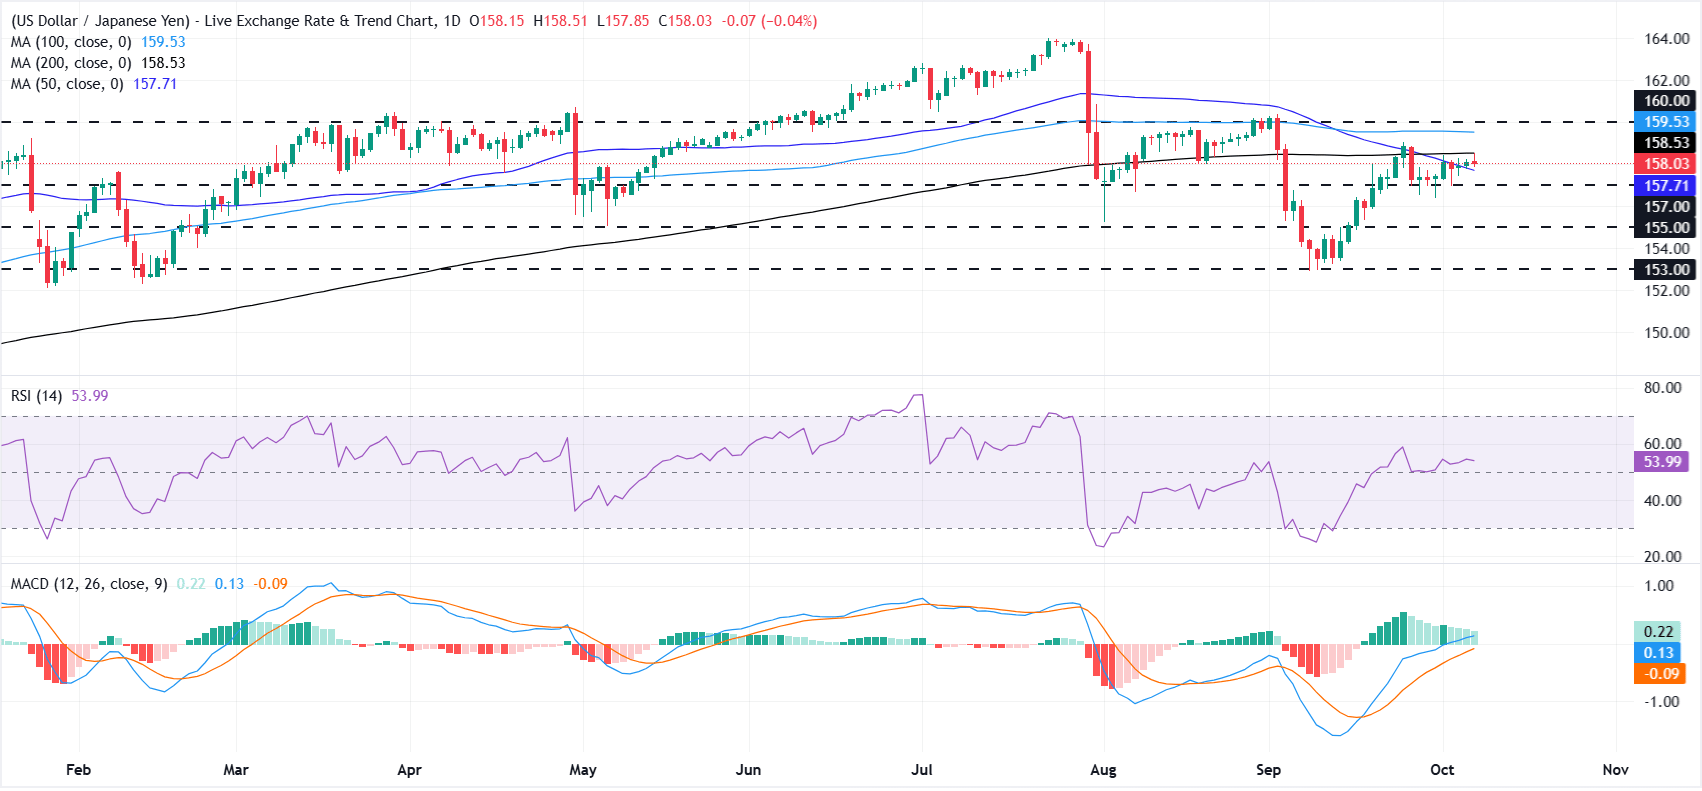
On the daily chart, USD/JPY holds just above the 50-day Simple Moving Average (SMA) at 157.70, but remains capped beneath the 200-day SMA at 158.53 and the 100-day SMA at 159.53, keeping the near-term bias bearish despite a modestly constructive tone in momentum. The Relative Strength Index (RSI) around 54 suggests recovering upside pressure, while the Moving Average Convergence Divergence (MACD) stays in positive territory, hinting at fading downside but not yet overcoming the overhead supply defined by the medium- and long-term averages.
On the topside, initial resistance is located at the 200-day SMA at 158.53, followed by the 100-day SMA near 159.53, with a stronger cap at the horizontal barrier of 160. On the downside, immediate support aligns with the 50-day SMA at 157.70, ahead of the 157 horizontal floor. Deeper retreats would expose the next supports at 155 and 153.
(The technical analysis of this story was written with the help of an AI tool. Know more.)
Japanese Yen Price Today
The table below shows the percentage change of Japanese Yen (JPY) against listed major currencies today. Japanese Yen was the strongest against the Euro.
| USD | EUR | GBP | JPY | CAD | AUD | NZD | CHF | |
|---|---|---|---|---|---|---|---|---|
| USD | 0.58% | 0.46% | -0.09% | 0.32% | 0.25% | 0.40% | 0.17% | |
| EUR | -0.58% | -0.12% | -0.65% | -0.26% | -0.32% | -0.17% | -0.41% | |
| GBP | -0.46% | 0.12% | -0.56% | -0.14% | -0.20% | -0.05% | -0.27% | |
| JPY | 0.09% | 0.65% | 0.56% | 0.41% | 0.35% | 0.49% | 0.27% | |
| CAD | -0.32% | 0.26% | 0.14% | -0.41% | -0.07% | 0.09% | -0.13% | |
| AUD | -0.25% | 0.32% | 0.20% | -0.35% | 0.07% | 0.15% | -0.07% | |
| NZD | -0.40% | 0.17% | 0.05% | -0.49% | -0.09% | -0.15% | -0.21% | |
| CHF | -0.17% | 0.41% | 0.27% | -0.27% | 0.13% | 0.07% | 0.21% |
The heat map shows percentage changes of major currencies against each other. The base currency is picked from the left column, while the quote currency is picked from the top row. For example, if you pick the Japanese Yen from the left column and move along the horizontal line to the US Dollar, the percentage change displayed in the box will represent JPY (base)/USD (quote).
Author
Vishal Chaturvedi
FXStreet
I am a macro-focused research analyst with over four years of experience covering forex and commodities market. I enjoy breaking down complex economic trends and turning them into clear, actionable insights that help traders stay ahead of the curve.

















