British Pound buckles as 30-year Gilts top 6%, US yields soar
- GBP/USD falls 0.48% after peaking near 1.3276.
- UK 30-year Gilt yield climbs above 6% amid fiscal concerns.
- Markets see 81% odds of a November BoE rate hike.
The Pound Sterling (GBP) dives over 0.48% against the US Dollar (USD) on Wednesday as US Treasury yields hit a 24-year high, boosting the Greenback’s appeal, while traders await the release of the Federal Reserve’s (Fed) last meeting minutes. At the time of writing, GBP/USD trades at 1.3210 after peaking near 1.3276.
Sterling slides as surging global yields boost the Dollar ahead of Fed Minutes
The UK economic docket remained absent, yet recent hawkish comments from Bank of England (BoE) member Catherine Mann and Governor Andrew Bailey, hinting at a potential interest-rate adjustment, capped Sterling losses against the Dollar.
The Bank of England has held rates unchanged throughout the year, but high energy prices have increased the chances of a November rate hike, with money markets now seeing an 81% chance.
In the meantime, borrowing costs in the UK saw the 30-year Gilt surpass the 6% mark, amid worries about France's fiscal fragility ahead of the 2027 presidential election. In the UK, the focus is on the release of the Autumn Budget on October 28 by Finance Minister John Healey.
Global bond yields began to rise after the resumption of hostilities between the US and Iran, amid fears that energy prices would remain elevated for longer, pressuring major central banks to act. Nonetheless, widening credit spreads between French and German debt are sounding the alarms in the European Union for a potential spread, triggering memories of 15 years ago, during Greece’s crisis.
In the US, the economic docket featured the New York Fed Survey of Consumer Expectations, which showed households are less optimistic about their financial situation and pushed one-year inflation expectations higher, from 3.6% in August to 3.9% in September.
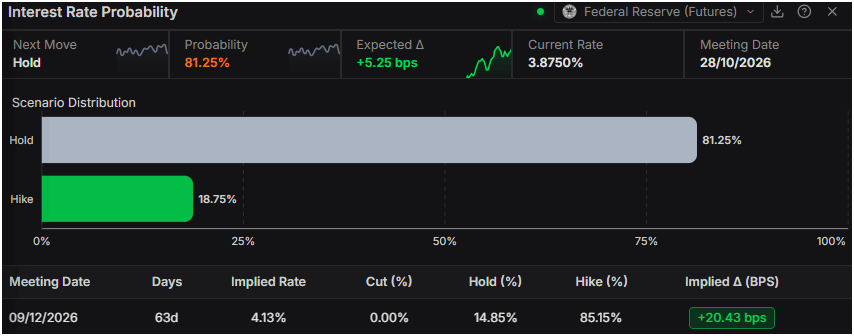
Traders shifted to the Federal Reserve’s September meeting minutes as they look for clues about the future of interest rates in the US. The latest inflation and jobs data triggered a U-turn for the current month’s meeting, and now money markets see the US central bank keeping interest rates at the 3.75%-4% range, but they expect 20 basis points of tightening in December, according to Prime Terminal.
Ahead, the US economic schedule will feature the release of Initial Jobless Claims on Thursday, followed on Friday by the University of Michigan's Consumer Confidence report.
GBP/USD Price Forecast: Technical outlook
In the daily chart, GBP/USD trades at 1.3210, keeping a bearish near-term bias as spot holds beneath the cluster of simple moving averages (SMA) around 1.3448 and the descending trend-line resistance coming in first at 1.3302 and then at 1.3426. The Relative Strength Index (14) at 36.15 stays below neutral, hinting at lingering downside pressure rather than outright oversold conditions, while Fed Sentiment Index readings near 137.91 suggest a still-firm dollar backdrop that reinforces the pair’s capped tone below these overhead technical barriers.
On the downside, initial structural support is aligned with the rising trend line from 1.3159, ahead of a deeper floor at the second upward trend-line origin around 1.3140. On the topside, a recovery would first need to clear the broken resistance trend line at 1.3302, with further upside scope only emerging if the pair advances towards and over the descending barrier at 1.3426 and the grouped daily SMAs near 1.3448.
(The technical analysis of this story was written with the help of an AI tool. Know more.)
Pound Sterling Price Today
The table below shows the percentage change of British Pound (GBP) against listed major currencies today. British Pound was the strongest against the Euro.
| USD | EUR | GBP | JPY | CAD | AUD | NZD | CHF | |
|---|---|---|---|---|---|---|---|---|
| USD | 0.57% | 0.48% | -0.11% | 0.35% | 0.26% | 0.39% | 0.17% | |
| EUR | -0.57% | -0.10% | -0.65% | -0.23% | -0.31% | -0.18% | -0.40% | |
| GBP | -0.48% | 0.10% | -0.58% | -0.13% | -0.21% | -0.07% | -0.29% | |
| JPY | 0.11% | 0.65% | 0.58% | 0.44% | 0.36% | 0.48% | 0.28% | |
| CAD | -0.35% | 0.23% | 0.13% | -0.44% | -0.09% | 0.05% | -0.15% | |
| AUD | -0.26% | 0.31% | 0.21% | -0.36% | 0.09% | 0.13% | -0.08% | |
| NZD | -0.39% | 0.18% | 0.07% | -0.48% | -0.05% | -0.13% | -0.20% | |
| CHF | -0.17% | 0.40% | 0.29% | -0.28% | 0.15% | 0.08% | 0.20% |
The heat map shows percentage changes of major currencies against each other. The base currency is picked from the left column, while the quote currency is picked from the top row. For example, if you pick the British Pound from the left column and move along the horizontal line to the US Dollar, the percentage change displayed in the box will represent GBP (base)/USD (quote).
Author

Christian Borjon Valencia
FXStreet
Markets analyst, news editor, and trading instructor with over 14 years of experience across FX, commodities, US equity indices, and global macro markets.