|

USD/JPY Price Analysis: Treads water around 151.70; next support at nine-day EMA

  • USD/JPY could meet the immediate barrier around March’s high of 151.97 and the psychological level of 152.00.
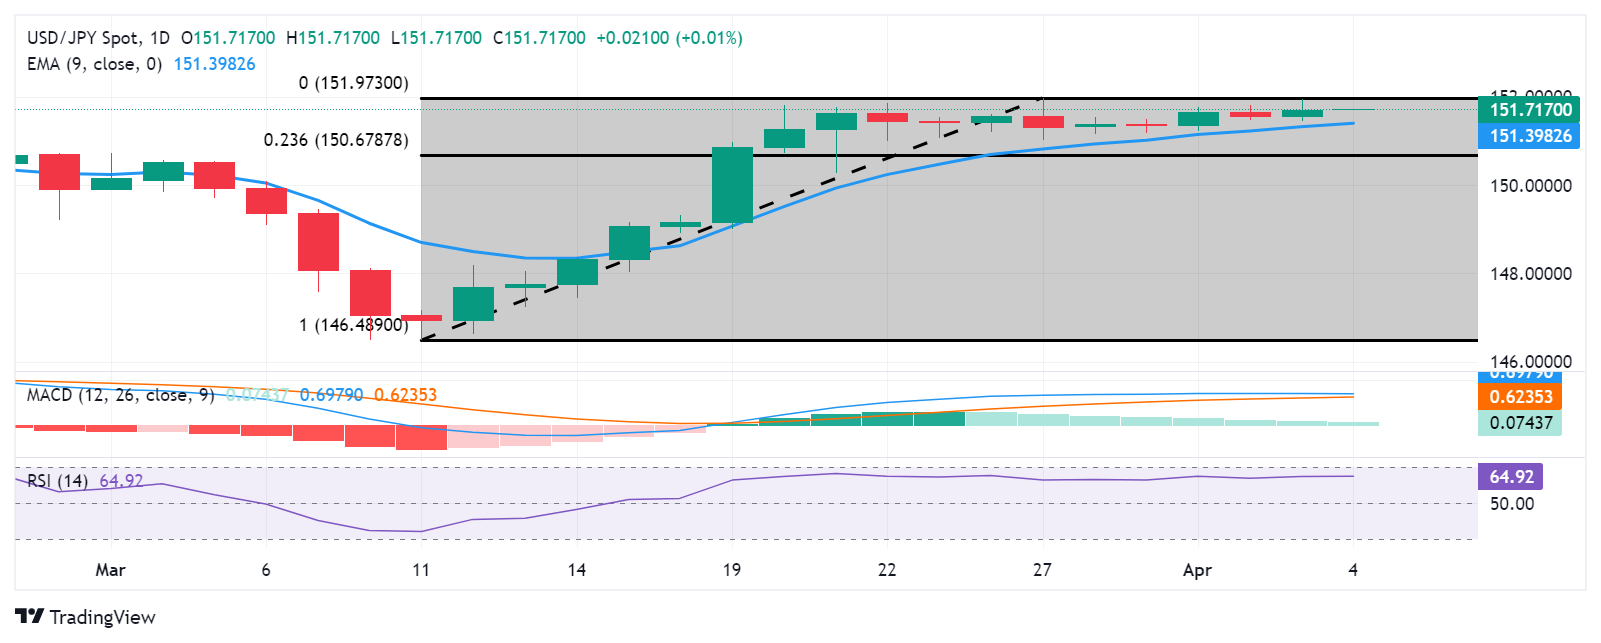
  • The lagging indicators suggest a confirmation of the bullish trend for the pair.
  • The pair could test the support region around the major level of 151.50 and the nine-day EMA at 151.39.

USD/JPY exhibits sideways trading on Thursday, hovering around 151.70 during the European trading hours. The pair may encounter immediate resistance around the recent high of 151.95 marked on Wednesday, which aligns with March’s high of 151.97 and the psychological level of 152.00.

A breakthrough above this level could support further upward movement, potentially allowing the USD/JPY pair to explore the region around the major level of 152.50.

The technical analysis for the USD/JPY pair indicates a bullish momentum, with the 14-day Relative Strength Index (RSI) positioned above the 50 level.

Additionally, the Moving Average Convergence Divergence (MACD) indicator confirms the bullish trend, with the MACD line above the centerline and showing divergence above the signal line.

On the downside, the USD/JPY could find immediate support at the significant level of 151.50, followed by the nine-day Exponential Moving Average (EMA) at 151.39.

A breach below the latter level might exert downward pressure on the USD/JPY pair, potentially leading to a test of the psychological mark of 151.00 before reaching the Fibonacci 23.6% retracement level of 150.67.

USD/JPY: Daily Chart

USD/JPY

Overview
Today last price151.71
Today Daily Change0.01
Today Daily Change %0.01
Today daily open151.7
 
Trends
Daily SMA20150.06
Daily SMA50149.62
Daily SMA100147.61
Daily SMA200147
 
Levels
Previous Daily High151.95
Previous Daily Low151.44
Previous Weekly High151.97
Previous Weekly Low151.03
Previous Monthly High151.97
Previous Monthly Low146.48
Daily Fibonacci 38.2%151.76
Daily Fibonacci 61.8%151.64
Daily Pivot Point S1151.44
Daily Pivot Point S2151.19
Daily Pivot Point S3150.94
Daily Pivot Point R1151.95
Daily Pivot Point R2152.21
Daily Pivot Point R3152.46

Author

Akhtar Faruqui

Akhtar Faruqui is a Forex Analyst based in New Delhi, India. With a keen eye for market trends and a passion for dissecting complex financial dynamics, he is dedicated to delivering accurate and insightful Forex news and analysis.

More from Akhtar Faruqui
Share:

Markets move fast. We move first.

Orange Juice Newsletter brings you expert driven insights - not headlines. Every day on your inbox.

By subscribing you agree to our Terms and conditions.

Editor's Picks

EUR/USD eyes 1.1800 barrier near two-month highs

EUR/USD extends its gains for the second consecutive day on Tuesday and approaches 1.1800. On the daily chart, technical analysis indicates a persistent bullish bias, as the pair moves upward within the ascending channel pattern. Additionally, the 14-day Relative Strength Index at 68.89 reaffirms the bullish bias.

GBP/USD climbs to 1.3500 area, renews ten-week high

GBP/USD extends its weekly rally and trades at its highest level since early October near 1.3500. The US Dollar remains under persistent bearish pressure heading into the holidays, while Pound traders largely brush off the latest interest rate cut from the Bank of England.

Gold approaches $4,500 as record-setting rally continues

Gold builds on Monday's impressive gains and advances toward $4,500, setting fresh record-highs along the way. Heightened geopolitical tensions, combined with the broad-based US Dollar (USD) weakness ahead of the Q3 GDP data, help XAU/USD preserve its bullish momentum.

US GDP expected to highlight steady growth in Q3

The United States Bureau of Economic Analysis (BEA) will publish the first preliminary estimate of the third-quarter Gross Domestic Product on Tuesday, at 13:30 GMT. Analysts expect the data to show annualized growth of 3.2%, following the 3.8% expansion in the previous quarter.

Ten questions that matter going into 2026

2026 may be less about a neat “base case” and more about a regime shift—the market can reprice what matters most (growth, inflation, fiscal, geopolitics, concentration). The biggest trap is false comfort: the same trades can look defensive… right up until they become crowded.

XRP steadies above $1.90 support as fund inflows and retail demand rise

Ripple (XRP) is stable above support at $1.90 at the time of writing on Monday, after several attempts to break above the $2.00 hurdle failed to materialize last week. Meanwhile, institutional interest in the cross-border remittance token has remained steady.