|

USD/JPY Price Analysis: Teeters around 138.00, cushioned by solid support as bulls target 139.00

  • USD/JPY stabilized, aided by Ichimoku Cloud and 100-day EMA.
  • Buyers target 50-day EMA at 139.99; sellers eye a break below 138.00.
  • Significant support and resistance lie at 200-day EMA levels.

USD/JPY seesaws around the top/bottom of the 138.00 figure as the Ichimoku Cloud (Kumo) cushions the USD/JPY’s pair fall. That, alongside the 100-day Exponential Moving Average (EMA) at 138.31, maintains the USD/JPY afloat, which trades at around 138.83 after hitting a daily low of 137.67.

USD/JPY Price Analysis: Technical outlook

The USD/JPY daily chart portrays the pair making a base after reaching a month-and-a-half low of 137.23 on July 14. Since then, the USD/JPY has not fallen below 137.50, but price action shows neither buyers nor sellers are in control. Nevertheless, if USD/JPY buyers would like to push prices higher, they will need to reclaim the 50-day Exponential Moving Average (EMA) at 139.99 before challenging the confluence of the 20 and 200-day EMAs at the 140.89/95 range.

For a bearish continuation, USD/JPY sellers would need to crack 138.00, followed by the current month’s low of 137.24, before slumping to the 137.00 psychological figure. Once cleared, the USD/JPY next support emerges at the 200-day EMA 136.47.

USD/JPY Price Action – Daily chart
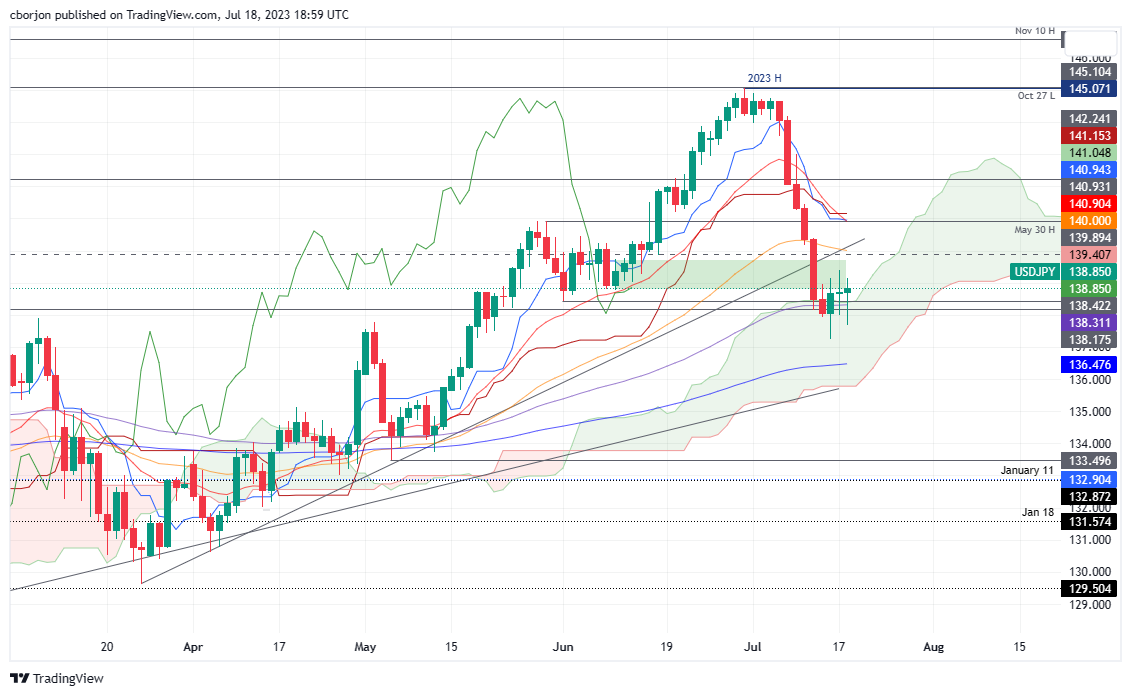
USD/JPY Daily chart

USD/JPY

Overview
Today last price138.82
Today Daily Change0.10
Today Daily Change %0.07
Today daily open138.72
 
Trends
Daily SMA20142.35
Daily SMA50140.22
Daily SMA100137.04
Daily SMA200137.05
 
Levels
Previous Daily High139.41
Previous Daily Low138
Previous Weekly High143
Previous Weekly Low137.24
Previous Monthly High145.07
Previous Monthly Low138.43
Daily Fibonacci 38.2%138.54
Daily Fibonacci 61.8%138.87
Daily Pivot Point S1138
Daily Pivot Point S2137.29
Daily Pivot Point S3136.59
Daily Pivot Point R1139.42
Daily Pivot Point R2140.12
Daily Pivot Point R3140.83

Author

Christian Borjon Valencia

Markets analyst, news editor, and trading instructor with over 14 years of experience across FX, commodities, US equity indices, and global macro markets.


More from Christian Borjon Valencia
Share:

Editor's Picks

GBP/USD advances to six-month high above 1.3650

GBP/USD extends its weekly rally and trades at its highest level since February above 1.3650 as the upbeat PMI data supports Pound Sterling despite disappointing Retail Sales figures. Meanwhile, the US Dollar (USD) struggles to stay resilient against its peers following the Treasury Department's decision to boost long-term bond purchases earlier in the week, helping the pair gather bullish momentum ahead of US PMI data.

EUR/USD rises above 1.1700 ahead of US PMI data

EUR/USD gains traction in the European session on Friday and trades above 1.1700 despite the mixed PMI prints from Germany and the Eurozone. Investors await preliminary August PMI surveys for the US, while the persistent USD weakness allows the pair to keep cling to its bullish stance.

Gold tests three-month highs near $4,600 as the US Dollar dives

Gold extends gains on Friday, with bulls aiming for a retest of the $4,600 resistance area, the top of the last six months' trading range. Precious metals are gaining momentum, favoured by a sharp US Dollar selloff, following the announcement of a US Treasury plan to boost liquidity to repurchase long-term securities.

Crypto Today: Bitcoin, Ethereum, XRP bulls accelerate rally amid rising ETF inflows

The cryptocurrency market remains bullish on Friday, led by Bitcoin’s surge above $77,000. Altcoins, including Ethereum and Ripple, mirror BTC’s positive outlook, trading near $2,400 and $1.35, respectively.

S&P Global US PMIs expected to ease slightly in August, still showing solid growth

S&P Global will release the preliminary figures of August’s US Purchasing Managers' Indices (PMIs). For August, the market consensus anticipates a mild slowdown in economic activity, with the Manufacturing PMI ticking down to 53.8 from July’s 53.9 reading and the Services PMI easing to 54.0 from last month’s 54.6.

$20 billion offered, $2 billion taken: Why Treasury doubled its buyback cap

The US Treasury moved off its own calendar on Wednesday, and that is the part worth sitting with. At 12:32 GMT, the department said it would at least double the size of liquidity support buyback operations in the 10-year to 20-year and 20-year to 30-year sectors, lifting the maximum from $2 billion per operation to at least $4 billion, effective September 9 and running to November 4.















