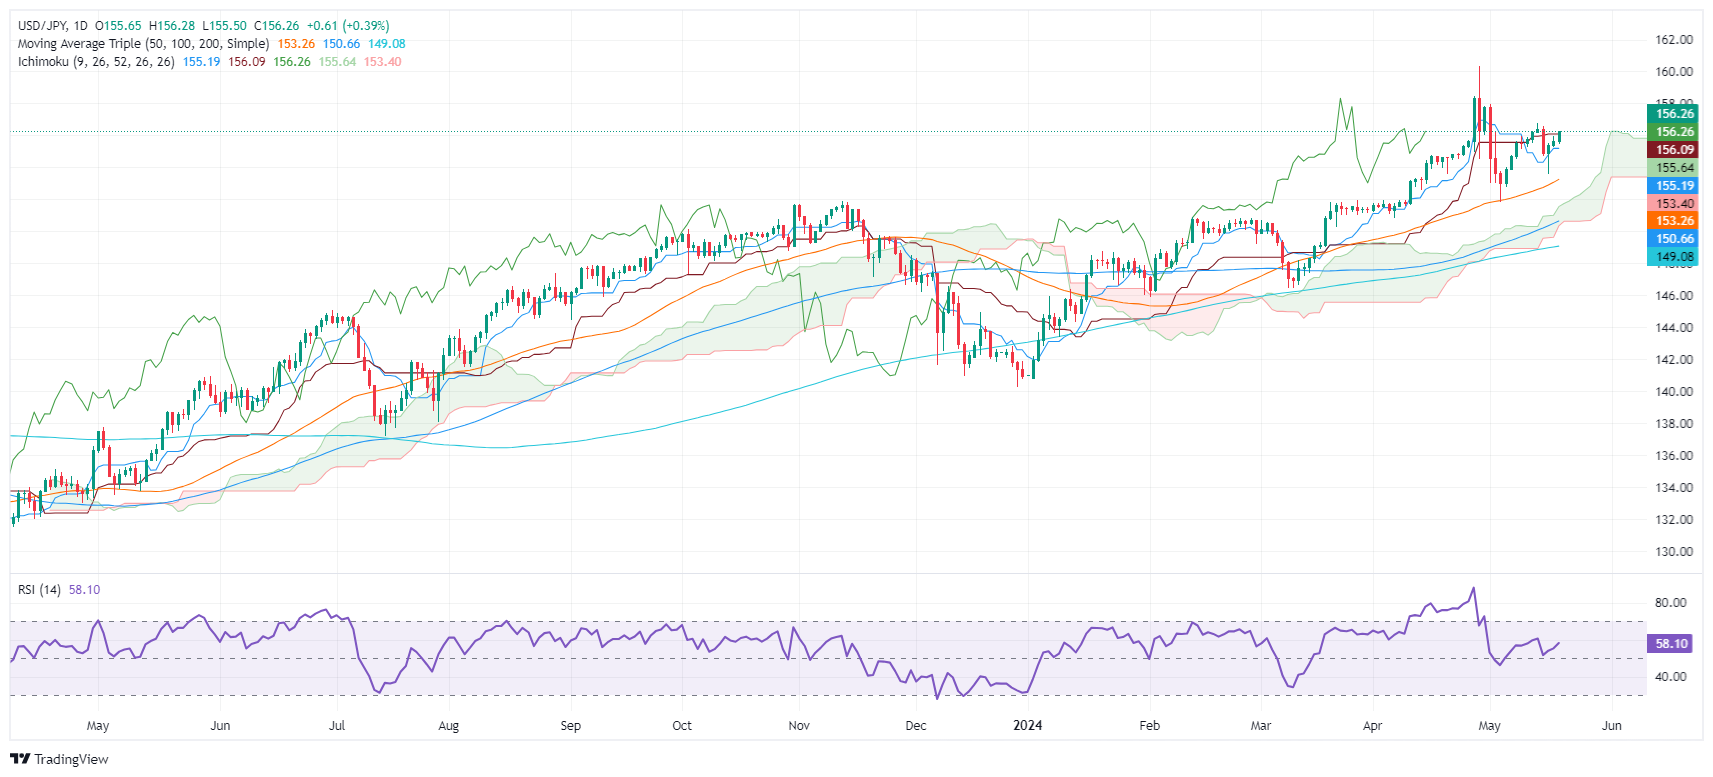
USD/JPY Price Analysis: Hits three-day high as bulls eye 157.00
- USD/JPY rises 0.38% after bouncing off a daily low of 155.49.
- Buyers favored in technical outlook; key resistance at 156.76 with potential to reach 157.99 and YTD high of 160.32.
- Bearish scenario could see support at 153.61, 153.25, and Ichimoku Cloud top at 151.94.

The US Dollar gains ground against the Japanese Yen (JPY) and climbs 0.38% in an upbeat market mood. US Treasury bond yields advance, particularly the 10-year Treasury note yield, which correlates positively to the USD/JPY pair. Therefore, the pair trades at 156.25 after hitting a daily low of 155.49.
USD/JPY Price Analysis: Technical outlook
The USD/JPY daily chart shows the pair remains tilted to the upside, yet it’s far from testing the latest cycle high. Nevertheless, the Relative Strength Index (RSI) shows momentum favors the buyers, which could open the door for further gains.
For a bullish continuation, the USD/JPY must clear the May 14 high of 156.76. Once done, buyers must surpass the May month-to-date (MTD) high of 157.99. A breach of the latter could expose the year-to-date (YTD) high of 160.32.
Conversely, if bears stepped in and dragged prices below the Senkou Span A at 156.25, that could sponsor a leg-down toward the May 16 low of 153.61. Further losses lie beneath, with the next support seen at the Senkou Span B at 153.25 before sliding toward the top of the Ichimoku Cloud at around 151.94.
USD/JPY Price Action – Daily Chart
Japanese Yen PRICE Today
The table below shows the percentage change of Japanese Yen (JPY) against listed major currencies today. Japanese Yen was the strongest against the New Zealand Dollar.
| USD | EUR | GBP | JPY | CAD | AUD | NZD | CHF | |
|---|---|---|---|---|---|---|---|---|
| USD | 0.07% | -0.04% | 0.42% | 0.04% | 0.38% | 0.42% | 0.12% | |
| EUR | -0.07% | -0.14% | 0.39% | -0.02% | 0.34% | 0.38% | 0.05% | |
| GBP | 0.04% | 0.14% | 0.40% | 0.12% | 0.48% | 0.51% | 0.19% | |
| JPY | -0.42% | -0.39% | -0.40% | -0.39% | -0.03% | 0.06% | -0.29% | |
| CAD | -0.04% | 0.02% | -0.12% | 0.39% | 0.29% | 0.40% | 0.07% | |
| AUD | -0.38% | -0.34% | -0.48% | 0.03% | -0.29% | 0.03% | -0.29% | |
| NZD | -0.42% | -0.38% | -0.51% | -0.06% | -0.40% | -0.03% | -0.33% | |
| CHF | -0.12% | -0.05% | -0.19% | 0.29% | -0.07% | 0.29% | 0.33% |
The heat map shows percentage changes of major currencies against each other. The base currency is picked from the left column, while the quote currency is picked from the top row. For example, if you pick the Japanese Yen from the left column and move along the horizontal line to the US Dollar, the percentage change displayed in the box will represent JPY (base)/USD (quote).
Author

Christian Borjon Valencia
FXStreet
Markets analyst, news editor, and trading instructor with over 14 years of experience across FX, commodities, US equity indices, and global macro markets.


