USD/JPY Price Analysis: Double bottom looms as bulls prepare a move towards the YTD high at 116.35


  • The US Treasury yields rally underpins the USD/JPY as it gains close to 0.70%.
  • Overall, US dollar strength across the board weighs on the USD/JPY pair.
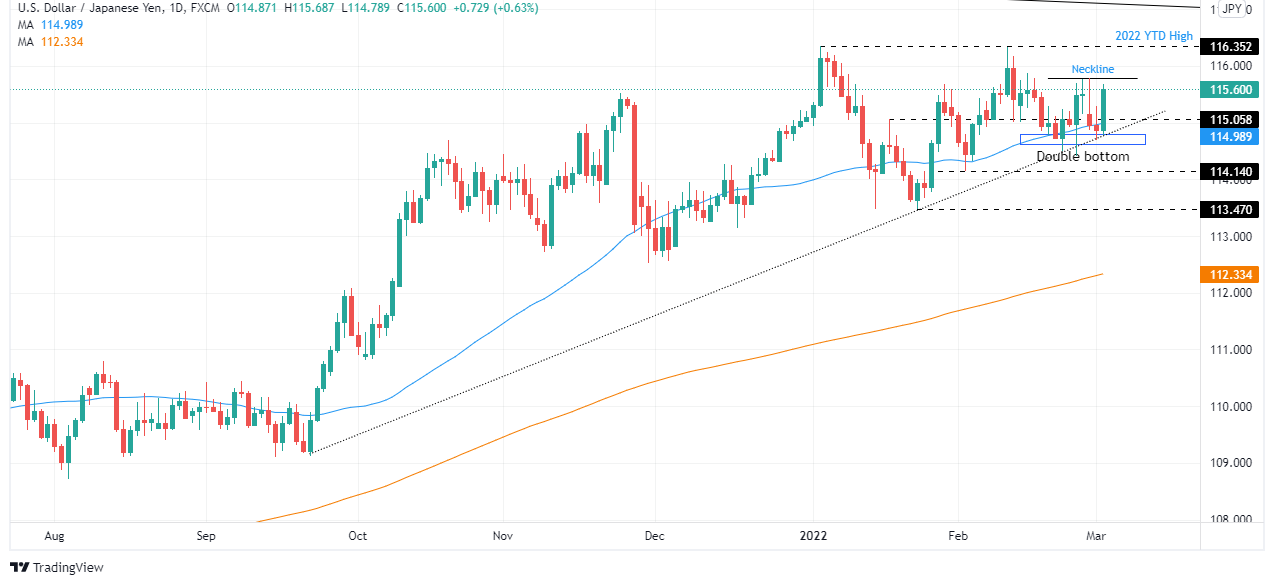
  • USD/JPY Technical Outlook: Upward biased, as shown by the DMAs under the exchange rate, alongside a double-bottom chart pattern.

Market mood improvement, spurred by reports of another round of talks between Russia-Ukraine, and higher US Treasury yields benefited the greenback. The USD/JPY rallies for the first time in the week, up some 0.70% in the day, trading at 115.63 at the time of writing.

Portraying the market’s sentiment, European equities finished Wednesday’s session in the green, while US stocks are advancing. US Treasury yield trims some of Tuesday’s sharp losses, led by the 10-year benchmark note rising 13 basis points, up at 1.844%. Higher yields are underpinning the greenback, with the US Dollar Index gaining 0.15%, sitting at 97.580.

USD/JPY Price Forecast: Technical outlook

After recording a low at 114.78, the USD/JPY has climbed steadily since the beginning of Wednesday’s Asian session. In the last three hours, it dipped from the R2 daily pivot at 115.63 to Tuesday’s high at 115.28 before resuming the uptrend, as USD/JPY bulls prepare an attack of the YTD high at 116.35.

The USD/JPY is upward biased, as depicted by two factors. Firstly, the daily moving averages (DMAs) reside below the spot price, and second, a potential double-bottom pattern in the daily chart. That said, the USD/JPY first resistance level would be the neckline around 115.78. Breach of the latter would expose 116.00, followed by the YTD high at 116.35.

USD/JPY

Overview
Today last price 115.6
Today Daily Change 0.78
Today Daily Change % 0.68
Today daily open 114.82
 
Trends
Daily SMA20 115.22
Daily SMA50 114.98
Daily SMA100 114.41
Daily SMA200 112.32
 
Levels
Previous Daily High 115.29
Previous Daily Low 114.7
Previous Weekly High 115.76
Previous Weekly Low 114.41
Previous Monthly High 116.34
Previous Monthly Low 114.16
Daily Fibonacci 38.2% 114.93
Daily Fibonacci 61.8% 115.06
Daily Pivot Point S1 114.59
Daily Pivot Point S2 114.35
Daily Pivot Point S3 114
Daily Pivot Point R1 115.18
Daily Pivot Point R2 115.53
Daily Pivot Point R3 115.77


Share: Feed news

Information on these pages contains forward-looking statements that involve risks and uncertainties. Markets and instruments profiled on this page are for informational purposes only and should not in any way come across as a recommendation to buy or sell in these assets. You should do your own thorough research before making any investment decisions. FXStreet does not in any way guarantee that this information is free from mistakes, errors, or material misstatements. It also does not guarantee that this information is of a timely nature. Investing in Open Markets involves a great deal of risk, including the loss of all or a portion of your investment, as well as emotional distress. All risks, losses and costs associated with investing, including total loss of principal, are your responsibility. The views and opinions expressed in this article are those of the authors and do not necessarily reflect the official policy or position of FXStreet nor its advertisers. The author will not be held responsible for information that is found at the end of links posted on this page.

If not otherwise explicitly mentioned in the body of the article, at the time of writing, the author has no position in any stock mentioned in this article and no business relationship with any company mentioned. The author has not received compensation for writing this article, other than from FXStreet.

FXStreet and the author do not provide personalized recommendations. The author makes no representations as to the accuracy, completeness, or suitability of this information. FXStreet and the author will not be liable for any errors, omissions or any losses, injuries or damages arising from this information and its display or use. Errors and omissions excepted.

The author and FXStreet are not registered investment advisors and nothing in this article is intended to be investment advice.

Recommended content


Recommended content

Editors’ Picks

AUD/USD jumps above 0.6500 after hot Australian CPI data

AUD/USD jumps above 0.6500 after hot Australian CPI data

AUD/USD extended gains and recaptured 0.6500 in Asian trading, following the release of hotter-than-expected Australian inflation data. The Australian CPI rose 1% in QoQ in Q1 against 0.8% forecast, providing extra legs to the Australian Dollar upside. 

AUD/USD News

USD/JPY hangs near 34-year high at 154.88 as intervention risks loom

USD/JPY hangs near 34-year high at 154.88 as intervention risks loom

USD/JPY is sitting at a multi-decade high of 154.88 reached on Tuesday. Traders refrain from placing fresh bets on the pair as Japan's FX intervention risks loom. Broad US Dollar weakness also caps the upside in the major. US Durable Goods data are next on tap. 

USD/JPY News

Gold price cautious despite weaker US Dollar and falling US yields

Gold price cautious despite weaker US Dollar and falling US yields

Gold retreats modestly after failing to sustain gains despite fall in US Treasury yields, weaker US Dollar. XAU/USD struggles to capitalize following release of weaker-than-expected S&P Global PMIs, fueling speculation about potential Fed rate cuts.

Gold News

Ethereum ETF issuers not giving up fight, expert says as Grayscale files S3 prospectus

Ethereum ETF issuers not giving up fight, expert says as Grayscale files S3 prospectus

Ethereum exchange-traded funds theme gained steam after the landmark approval of multiple BTC ETFs in January. However, the campaign for approval of this investment alternative continues, with evidence of ongoing back and forth between prospective issuers and the US SEC.

Read more

US versus the Eurozone: Inflation divergence causes monetary desynchronization

US versus the Eurozone: Inflation divergence causes monetary desynchronization

Historically there is a very close correlation between changes in US Treasury yields and German Bund yields. This is relevant at the current juncture, considering that the recent hawkish twist in the tone of the Fed might continue to push US long-term interest rates higher and put upward pressure on bond yields in the Eurozone.

Read more

Forex MAJORS

Cryptocurrencies

Signatures