|

USD/JPY Price Analysis: Dollar extends losses as market fears embolden yen

  • USD/JPY is retracing down for the third day in a row after last week’s massive bullish breakout.
  • The level to beat for bears is the 109.80 support.
  • Coronavirus fears are sending markets in risk-off mode, attracting investor to buy yen.
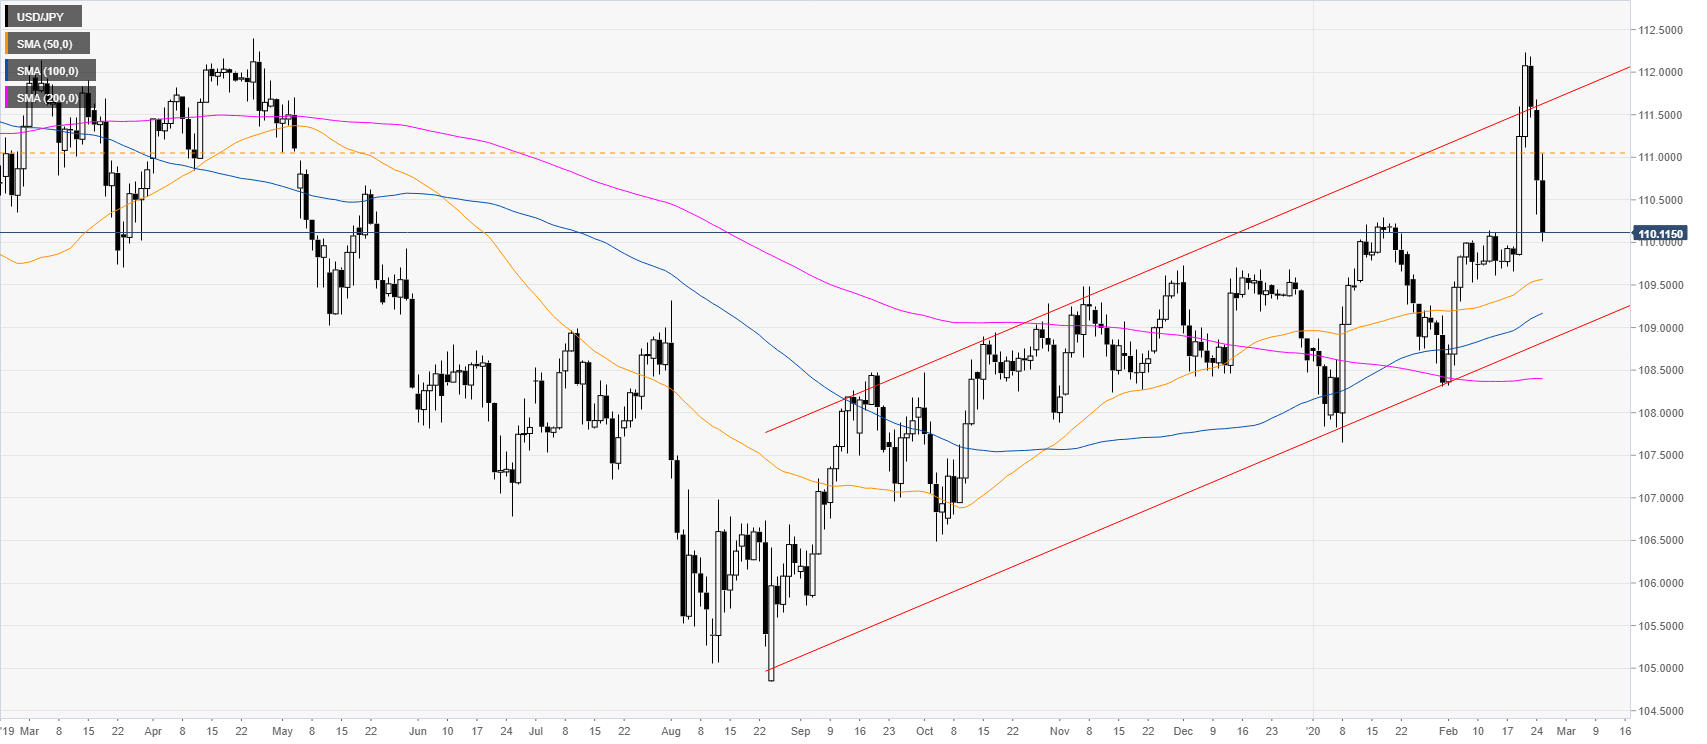
 

USD/JPY daily chart

 
USD/JPY is trading in an ascending channel while above the main daily simple moving averages (SMAs). The quote is correcting down after a massive breakout last week. As the Coronavirus is spreading the markets are entering risk-off mode, increasing the demand for yen.
 

USD/JPY four-hour chart

 
As expected the spot broke below the 110.65/35 support zone opening the gates to a deeper pullback down towards the 109.80 and 109.30 levels. The 110.65/35 support zone is now turning resistance and could weather bullish attempts.
  
 
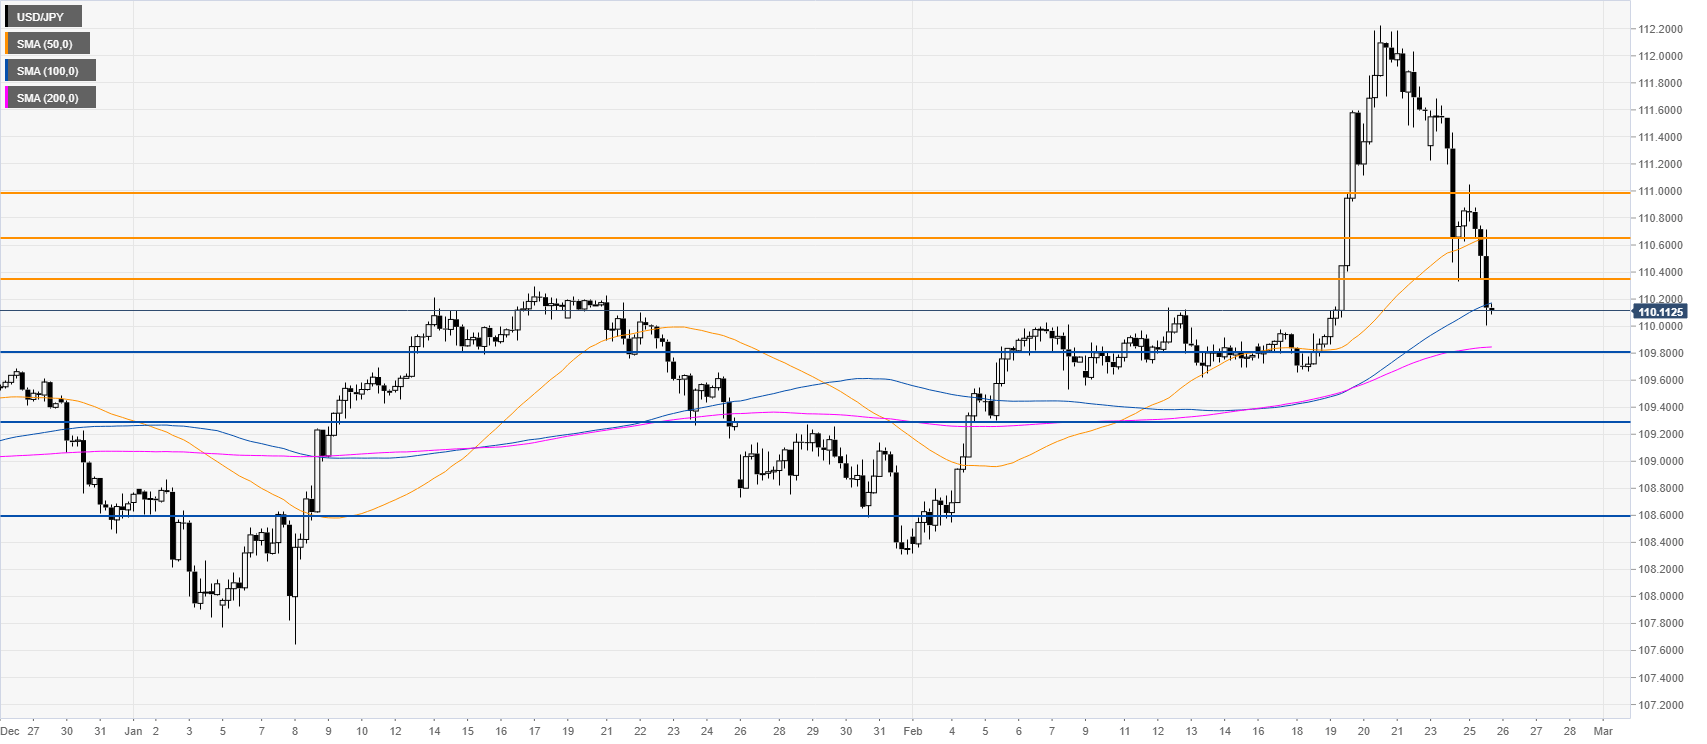
Resistance: 110.65, 110.35, 111.00
Support: 109.80, 109.30, 108.60


Additional key levels

USD/JPY

Overview
Today last price111.59
Today Daily Change0.86
Today Daily Change %0.78
Today daily open110.73
 
Trends
Daily SMA20109.89
Daily SMA50109.57
Daily SMA100109.15
Daily SMA200108.41
 
Levels
Previous Daily High111.68
Previous Daily Low110.33
Previous Weekly High112.23
Previous Weekly Low109.66
Previous Monthly High110.29
Previous Monthly Low107.65
Daily Fibonacci 38.2%110.85
Daily Fibonacci 61.8%111.17
Daily Pivot Point S1110.15
Daily Pivot Point S2109.56
Daily Pivot Point S3108.79
Daily Pivot Point R1111.5
Daily Pivot Point R2112.27
Daily Pivot Point R3112.85

Author

Flavio Tosti

Flavio Tosti

Independent Analyst


More from Flavio Tosti
Share:

Editor's Picks

EUR/USD extends losses toward 1.1600 ahead of EU inflation data

EUR/USD extends the decline toward 1.1600 in the European session on Tuesday. The pair remains under pressure as surging energy prices amid the US-Iran war have increased the risks of higher inflation for the Old Continent. The focus is now on the Eurozone preliminary inflation reading for February. 

GBP/USD drops back toward three-month lows below 1.3350

GBP/USD is back in the red, accelerating its downside toward the three-month lows of 1.3315 in European trading on Tuesday. The ongoing escalation in the Iran war, combined with rising Oil prices, weighs negatively on the higher-yielding Pound Sterling as the US Dollar preserves the previous upside. 

Gold weakens below $5,300 as sustained USD buying counter Middle East tensions

Gold attracts some intraday selling and falls around $100 from the daily top, around the $5,380 area. The US Dollar climbs to a fresh high since January 20 and turns  out to be a key factor exerting downward pressure on the commodity. However, concerns about a broader regional conflict in the Middle East continue to weigh on investors' sentiment and underpin demand for the traditional safe-haven bullion.

Stellar risks deeper losses as derivatives metrics turn negative

Stellar is trading red below $0.16 at the time of writing on Tuesday, after a slight recovery the previous day. Weakening derivatives data caps the recovery, while an unfavorable technical outlook projects a deeper correction for the XLM token in the upcoming days.

The market is not panicking it is repricing the probability distribution of Oil and time

At the end of the day, markets do not trade morality or geopolitics. They trade transmission channels. And the only channel that truly matters in this maelstrom runs through the price of energy and the time value of money.

Hyperliquid Price Forecast: HYPE rises on commodities demand amid US-Iran war

Hyperliquid (HYPE) steadies above $33 at press time on Tuesday, marking its fourth consecutive day of recovery in a broadly volatile market due to the ongoing US-Israel strikes on Iran.