|

USD/JPY Price Analysis: Climbs above 156.00 as bulls target 157.00

  • USD/JPY up 0.17% driven by US producer price data suggesting potential for sustained high Fed rates.
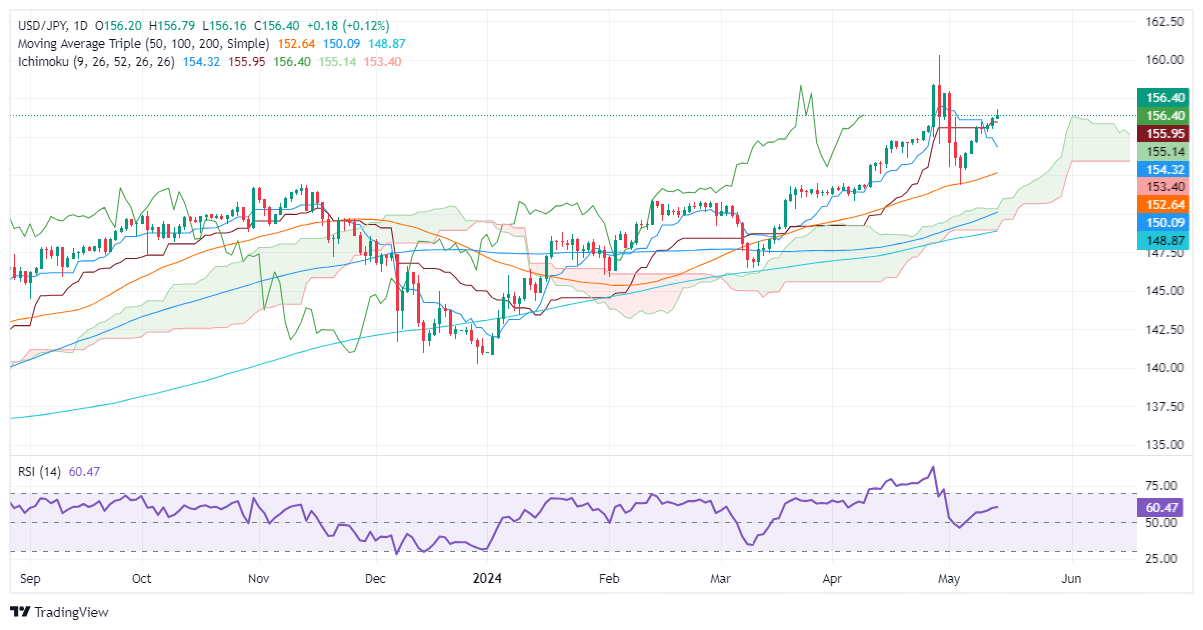
  • Technicals: Six days of gains, with strong upward momentum above the Ichimoku Cloud.
  • Resistance at 157.00, then May 1 high of 157.98 and April 26 high of 158.44.
  • Support at 156.00, 155.90 (Kijun-Sen), and 155.10 (Senkou Span A).

The USD/JPY climbed during the North American session after inflation data in the United States (US) showed that prices on the producer side edged higher than expected. This suggests the Fed might maintain rates higher for longer amid fears that consumer inflation could reaccelerate. The pair trades at 156.48, up by 0.17%.

USD/JPY Price Analysis: Technical outlook

The USD/JPY extended its gains for the sixth consecutive trading day, reigniting fears that Japanese authorities could intervene in the Forex markets. Momentum remains tilted to the upside, as price action remains above the Ichimoku Cloud (Kumo). At the same time, the Relative Strength Index (RSI) trends are higher in bullish territory, which could open the door to re-test yearly highs.

If buyers reclaim the 157.00 figure, that could open the door to challenging the May 1 high at 157.98. Once surpassed, key resistance levels emerge, like Apri’s26 high at 158.44, followed by the April 29 high of 160.22.

On the other hand, if sellers drag prices below 156.00, further losses lie below. The next support would be the Kijun-Sen at 155.90. Should the pair extend its downtrend, the next demand area emerges at the Senkou Span A at 155.10 before sellers challenge the Tenkan-Sen at 154.31.

USD/JPY Price Action – Daily Chart

USD/JPY

Overview
Today last price156.39
Today Daily Change0.17
Today Daily Change %0.11
Today daily open156.22
 
Trends
Daily SMA20155.23
Daily SMA50152.51
Daily SMA100149.95
Daily SMA200148.8
 
Levels
Previous Daily High156.25
Previous Daily Low155.51
Previous Weekly High155.95
Previous Weekly Low152.8
Previous Monthly High160.32
Previous Monthly Low150.81
Daily Fibonacci 38.2%155.97
Daily Fibonacci 61.8%155.79
Daily Pivot Point S1155.73
Daily Pivot Point S2155.25
Daily Pivot Point S3154.99
Daily Pivot Point R1156.48
Daily Pivot Point R2156.74
Daily Pivot Point R3157.22

Author

Christian Borjon Valencia

Christian Borjon began his career as a retail trader in 2010, mainly focused on technical analysis and strategies around it. He started as a swing trader, as he used to work in another industry unrelated to the financial markets.

More from Christian Borjon Valencia
Share:

Markets move fast. We move first.

Orange Juice Newsletter brings you expert driven insights - not headlines. Every day on your inbox.

By subscribing you agree to our Terms and conditions.

Editor's Picks

EUR/USD moves sideways below 1.1800 on Christmas Eve

EUR/USD struggles to find direction and trades in a narrow channel below 1.1800 after posting gains for two consecutive days. Bond and stock markets in the US will open at the usual time and close early on Christmas Eve, allowing the trading action to remain subdued. 

GBP/USD keeps range around 1.3500 amid quiet markets

GBP/USD keeps its range trade intact at around 1.3500 on Wednesday. The Pound Sterling holds the upper hand over the US Dollar amid pre-Christmas light trading as traders move to the sidelines heading into the holiday season. 

Gold retreats from record highs, trades below $4,500

Gold retreats after setting a new record-high above $4,520 earlier in the day and trades in a tight range below $4,500 as trading volumes thin out ahead of the Christmas break. The US Dollar selling bias remains unabated on the back of dovish Fed expectations, which continues to act as a tailwind for the bullion amid persistent geopolitical risks.

Bitcoin slips below $87,000 as ETF outflows intensify, whale participation declines

Bitcoin price continues to trade around $86,770 on Wednesday, after failing to break above the $90,000 resistance. US-listed spot ETFs record an outflow of $188.64 million on Tuesday, marking the fourth consecutive day of withdrawals.

Economic outlook 2026-2027 in advanced countries: Solidity test

After a year marked by global economic resilience and ending on a note of optimism, 2026 looks promising and could be a year of solid economic performance. In our baseline scenario, we expect most of the supportive factors at work in 2025 to continue to play a role in 2026.

Avalanche struggles near $12 as Grayscale files updated form for ETF

Avalanche trades close to $12 by press time on Wednesday, extending the nearly 2% drop from the previous day. Grayscale filed an updated form to convert its Avalanche-focused Trust into an ETF with the US Securities and Exchange Commission.