USD/JPY Price Analysis: Bears pause near 38.2% Fibo., US CPI eyed for fresh impetus
- USD/JPY prolongs its downfall for the fifth straight day and drops to a nearly one-month trough.
- Bets the Fed will end its rate-hiking cycle soon weighs on the USD and exerts downward pressure.
- Expectations that the BoJ will shift its policy stance boosts the JPY and contributes to the decline.
- The oversold RSI on hourly charts helps limit any further losses ahead of the crucial US CPI report.

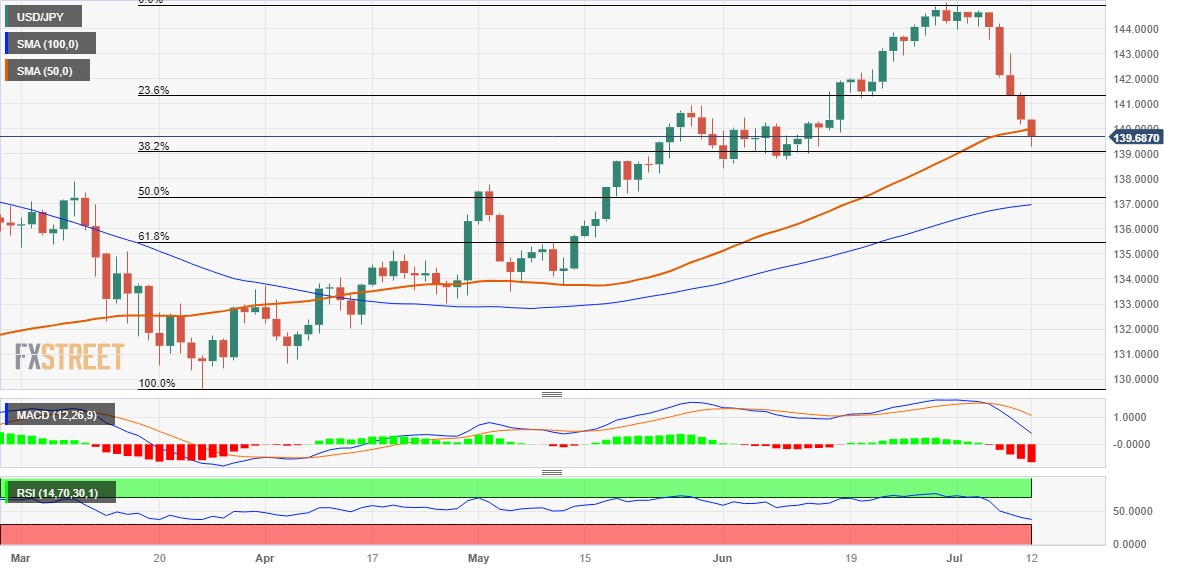
The USD/JPY pair extends its recent sharp pullback from the YTD peak - levels just above the 145.00 psychological mark - and continues drifting lower for the fifth successive day on Wednesday. The downward trajectory drags spot prices to the 139.30 level, or a nearly one-month low during the early European session, though pauses near the 38.2% Fibonacci retracement level of the March-June rally.
The bearish pressure surrounding the US Dollar (USD) remains unabated in the wake of speculations that the Federal Reserve (Fed) will end its rate-hiking cycle following a 25 bps lift-off in July. The Japanese Yen (JPY), on the other hand, draws support from expectations that the Bank of Japan (BOJ) will adjust its ultra-loose policy settings as soon as this month, which, in turn, contributes to the USD/JPY pair's downfall witnessed over the past week or so.
That said, a generally positive tone around the equity markets undermines demand for the safe-haven Japanese Yen (JPY) and lends some support to spot prices. Traders also seem reluctant to place aggressive bets and prefer to wait on the sidelines ahead of the US consumer inflation figures, due for release later during the early North American session. The crucial US CPI report should influence the USD and provide some meaningful impetus to the USD/JPY pair.
In the meantime, the extremely oversold Relative Strength Index (RSI) on hourly charts is seen helping limit the downside, at least for the time being. That said, acceptance below the 50-day Simple Moving Average (SMA) and bearish technical indicators on the daily chart suggest that the path of least resistance for the USD/JPY pair is to the downside. Bears, however, might still wait for some intraday consolidation or a modest bounce before placing fresh bets.
From current levels, the 38.2% Fibo. level could protect the immediate downside ahead of the 139.00 mark, which if broken will be seen as a fresh trigger for bearish traders. The USD/JPY pair might then accelerate the depreciating move towards testing sub-138.00 levels, representing the 61.8% Fibo. level.
On the flip side, the 140.00 psychological mark now seems to act as an immediate hurdle, above which a bout of a short-covering move could lift the USD/JPY pair towards the 140.60 area, representing the 50% Fibo. level. Any subsequent move up, however, might still be seen as a selling opportunity around the 141.00 mark and remain capped near the 141.20-141.25 region. A sustained strength beyond the latter is needed to negate the negative outlook.
USD/JPY daily chart
Key levels to watch
Author

Haresh Menghani
FXStreet
Haresh Menghani is a detail-oriented professional with 10+ years of extensive experience in analysing the global financial markets.


